


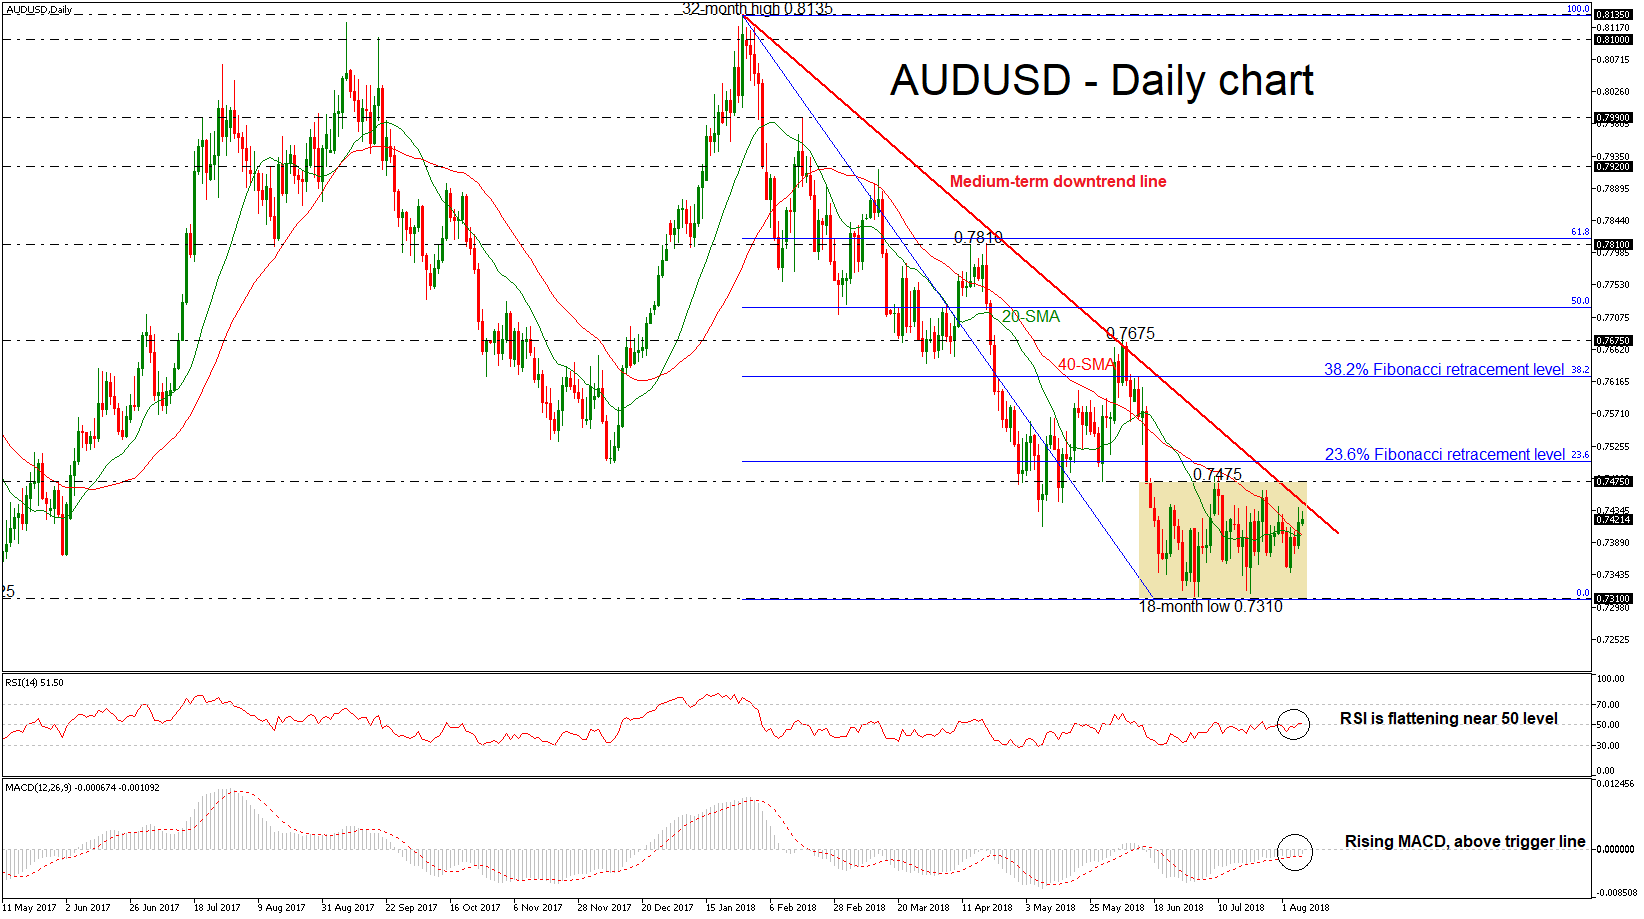
 AUDUSD has been struggling within a consolidation area during the last seven weeks with upper boundary the 0.7475 resistance level and lower boundary the 18-month low of 0.7310. Furthermore, the pair successfully surpassed the 20- and 40-simple moving averages (SMAs) in the daily timeframe.
Technically, momentum indicators are endorsing the neutral to bullish movement in the market. The RSI indicator is flattening and stands near the threshold of 50, however, the MACD oscillator is moving higher in the negative territory above its trigger line and is approaching the zero line with weak momentum. Also, the SMAs are ready to record a bullish crossover in the near term.
Moving higher, the first resistance for investors to have in mind is the upper boundary (0.7475). If there is a jump above this region, the price could challenge the 23.6% Fibonacci retracement level of 0.7505 of the downleg from 0.8135 to 0.7310, increasing the chances for a bullish retracement. Above this barrier, if there is an upside penetration of the falling trend line, the focus shifts to the upside until the 38.2% Fibonacci of 0.7625.
However, if the price slips below the moving averages, this could open the way towards the 18-month low (0.7310). Further downside extensions could drive the pair until the 0.7160 hurdle, where it bottomed on December 2016.
To conclude, in the bigger picture, AUDUSD has been trading within a descending move since January 26, however, in the short-term price action endorses the scenario for a sideways move but it also remains below the downtrend line.
Origin: XM


