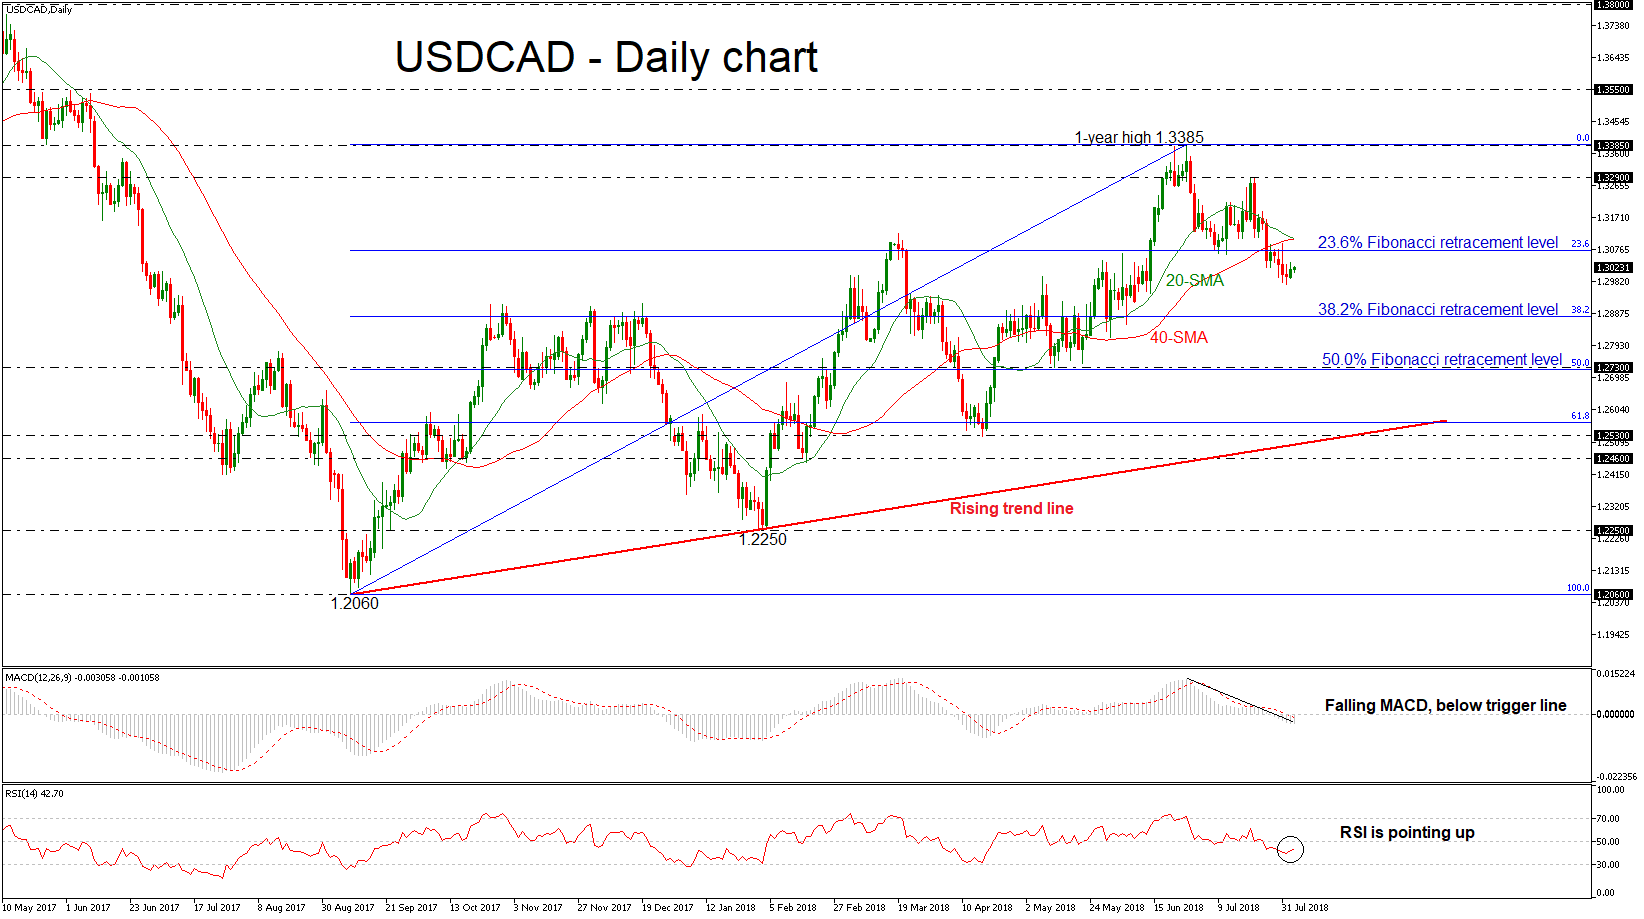
 USDCAD formed a fresh seven-week bottom at 1.2974 on August 1 in the daily timeframe after the downfall below the strong obstacle of the 23.6% Fibonacci retracement level of the upleg from 1.2060 to 1.3385, around 1.3074. The pair seems to be in a bearish correction mode as the technical indicators are confirming the scenario for a possible downside pressure.
The RSI and the MACD have both weakened, with the former sloping slightly up below the 50 level and the latter easing below its red trigger and zero lines. Also, the 20- and 40- simple moving averages (SMAs) are ready to record a bearish crossover in the short-term.
Should the price decline further, traders could look for support at the 38.2% Fibonacci region near 1.2880. A fail attempt to hold above this level could open the door for the 50.0% Fibonacci, which stands near the 1.2730 barrier. Even lower, the area near the 61.8% Fibonacci and the medium-term ascending trend line could be another target for the bears.
On the upside, the zone within the 1.3074 and 1.3110, outlined by the 23.6% Fibonacci and the moving averages, could provide immediate resistance. Beyond this area, resistance could then run towards the 1.3290 price level, taken from the peak on July 19. A bullish rally above this hurdle could open the way for the one-year high of 1.3385.
Having a look at the bigger picture, dollar/loonie has been trading within an ascending movement since September 2017, but in the short-term, the price seems to be in a retracement mode over the last five weeks.
Origin: XM