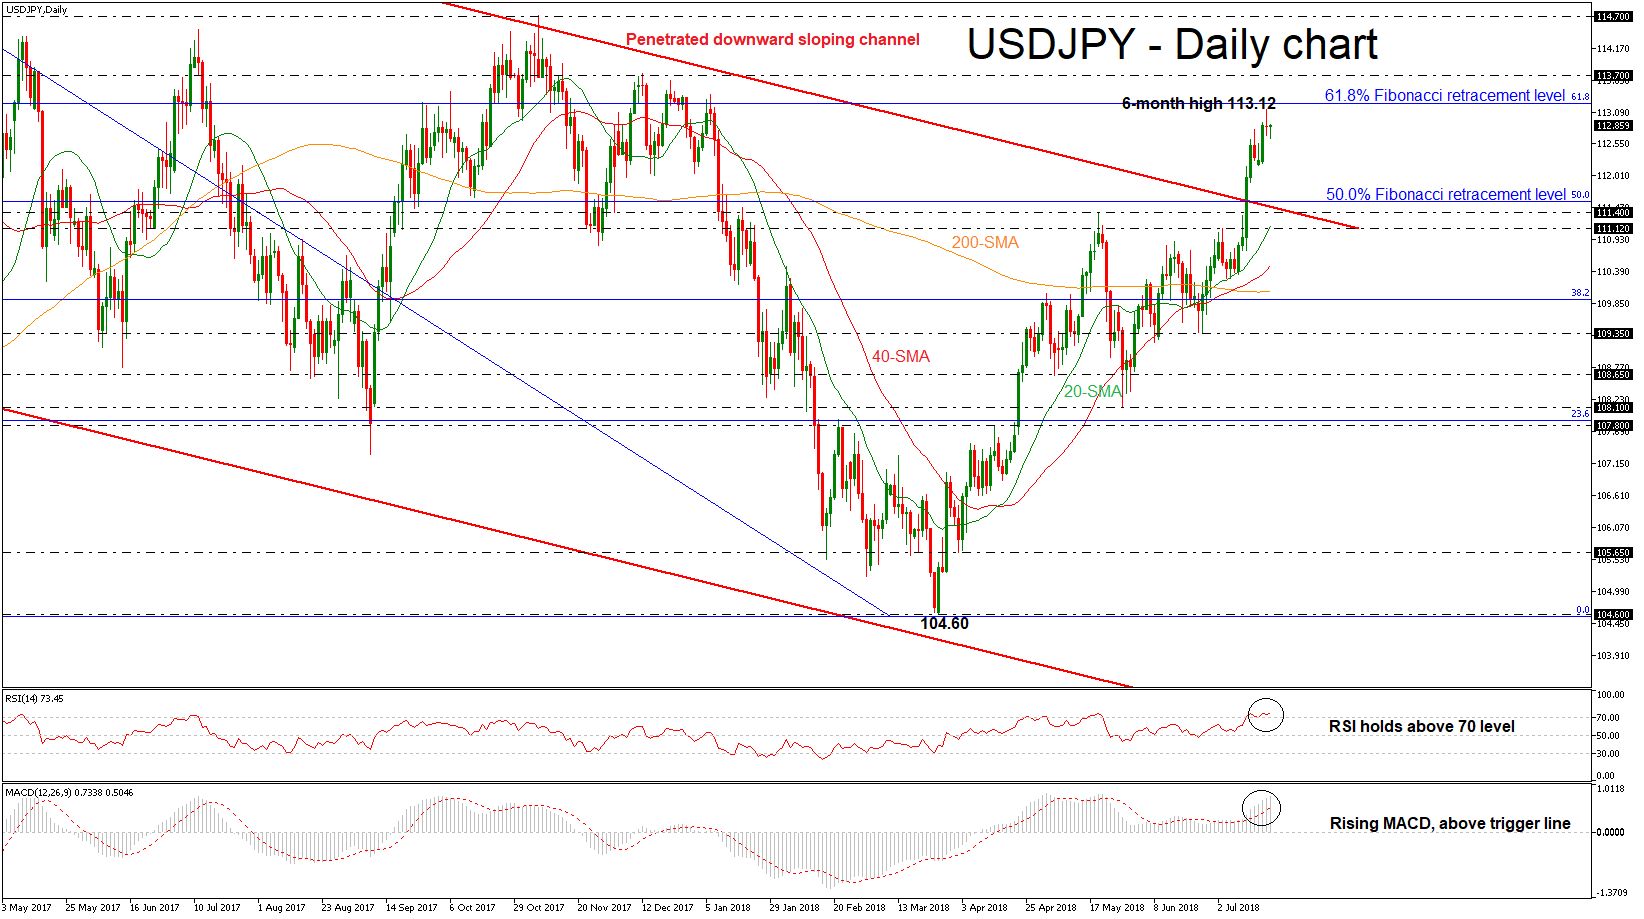
 USDJPY penetrated the downward sloping channel to the upside during the preceding week, implying that a sharp bullish movement is coming. However, over Wednesday’s session, the price posted a bearish doji candle after it hit a six-month high of 113.12, giving the possibility for a downward correction in the near term. The short-term technical indicators are endorsing the scenario for a rising movement.
In the daily timeframe, the RSI indicator is holding within the overbought zone but has been flattening over the past few sessions, while the MACD oscillator is strengthening its momentum and lies well above its trigger and zero lines. It is worth mentioning that the short-term SMAs (20 and 40) crossed to the upside of the medium-term SMA (200), signaling upside pressures.
Immediate resistance is being provided by the 61.8% Fibonacci retracement level of the downleg from 118.60 to 104.60, around 113.23. A successful climb above this level would extend gains until the 113.70 hurdle, taken from the peak on December 2017. Moreover, an overcoming of the aforementioned obstacle could see the market retesting the 114.70 barrier, where it topped in November 2016.
Should the market dip lower, support could be met between the 50.0% Fibonacci mark of 111.57 and the 111.40 support, identified by the high on May 21. Then if the market fails to hold above these levels, the next stop could be at 111.12, which stands near the 20-day simple moving average (SMA).
To conclude, USDJPY has advanced considerably over the past four months after the rebound on the 104.60 support and seems to be ready for a new bullish ride.
Origin: XM