


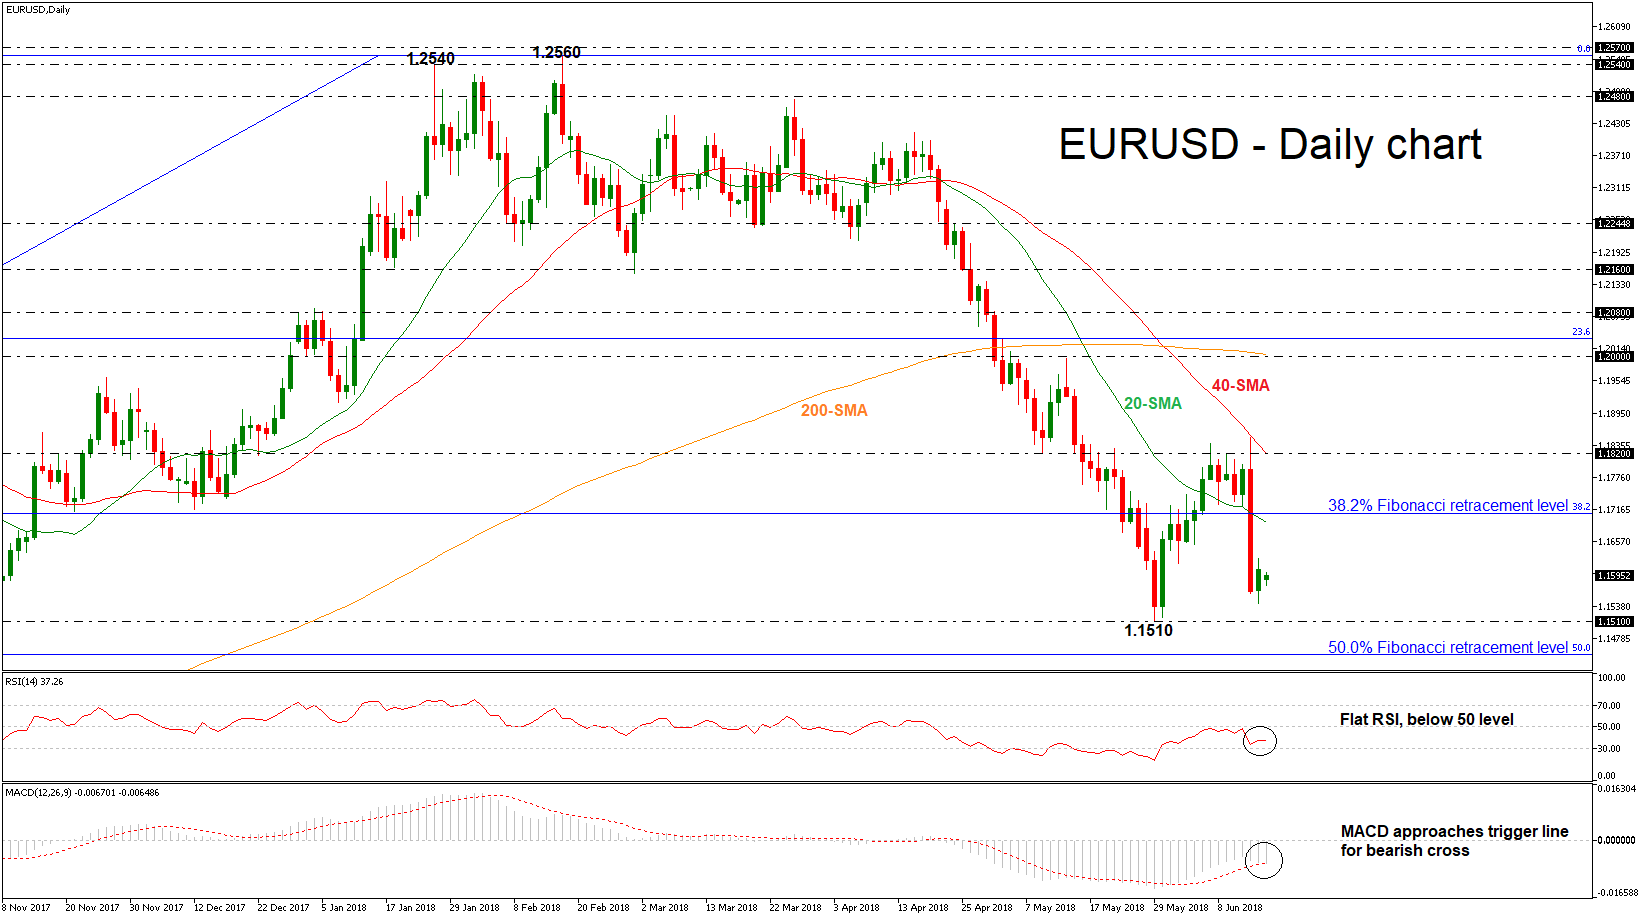
 EURUSD is attempting to reverse some of Thursday’s aggressive losses but the risk is still to the downside as the trend remains bearish. The price dived below the 38.2% Fibonacci retracement level of the upleg from 1.0340 to 1.2560, around 1.1710. The short-term technical indicators are neutral to bearish and point to more weakness in the market.
Looking at the daily timeframe, the moving averages are sloping down following the price action. The Relative Strength Index (RSI) is flat in the negative territory, while the MACD oscillator is ready for a bearish cross with its trigger line below the zero threshold.
The next target to the downside to have in mind is the 1.1510 support, taken from the low on May 29. At this stage the market could breach this level and challenge the 50.0% Fibonacci near 1.1450.
Upsides moves are likely to find resistance at the 20-day simple moving average (SMA), which stands slightly below the 38.2% Fibonacci of 1.1710. Rising above this area would help shift the focus to the upside towards the 1.1820 resistance, which overlaps with the 40-day SMA. Breaking this level could see a re-test of the 1.2000 strong psychological obstacle, holding near the 200-day SMA, and turn the bias to bullish for the near-term.
In the short-term, the bearish phase remains in play especially if EURUSD continues to trade below the 38.2% Fibonacci and under the moving averages. In the bigger picture, the market seems to be in a downward correction of the uptrend from January 2017.
Origin: XM


