


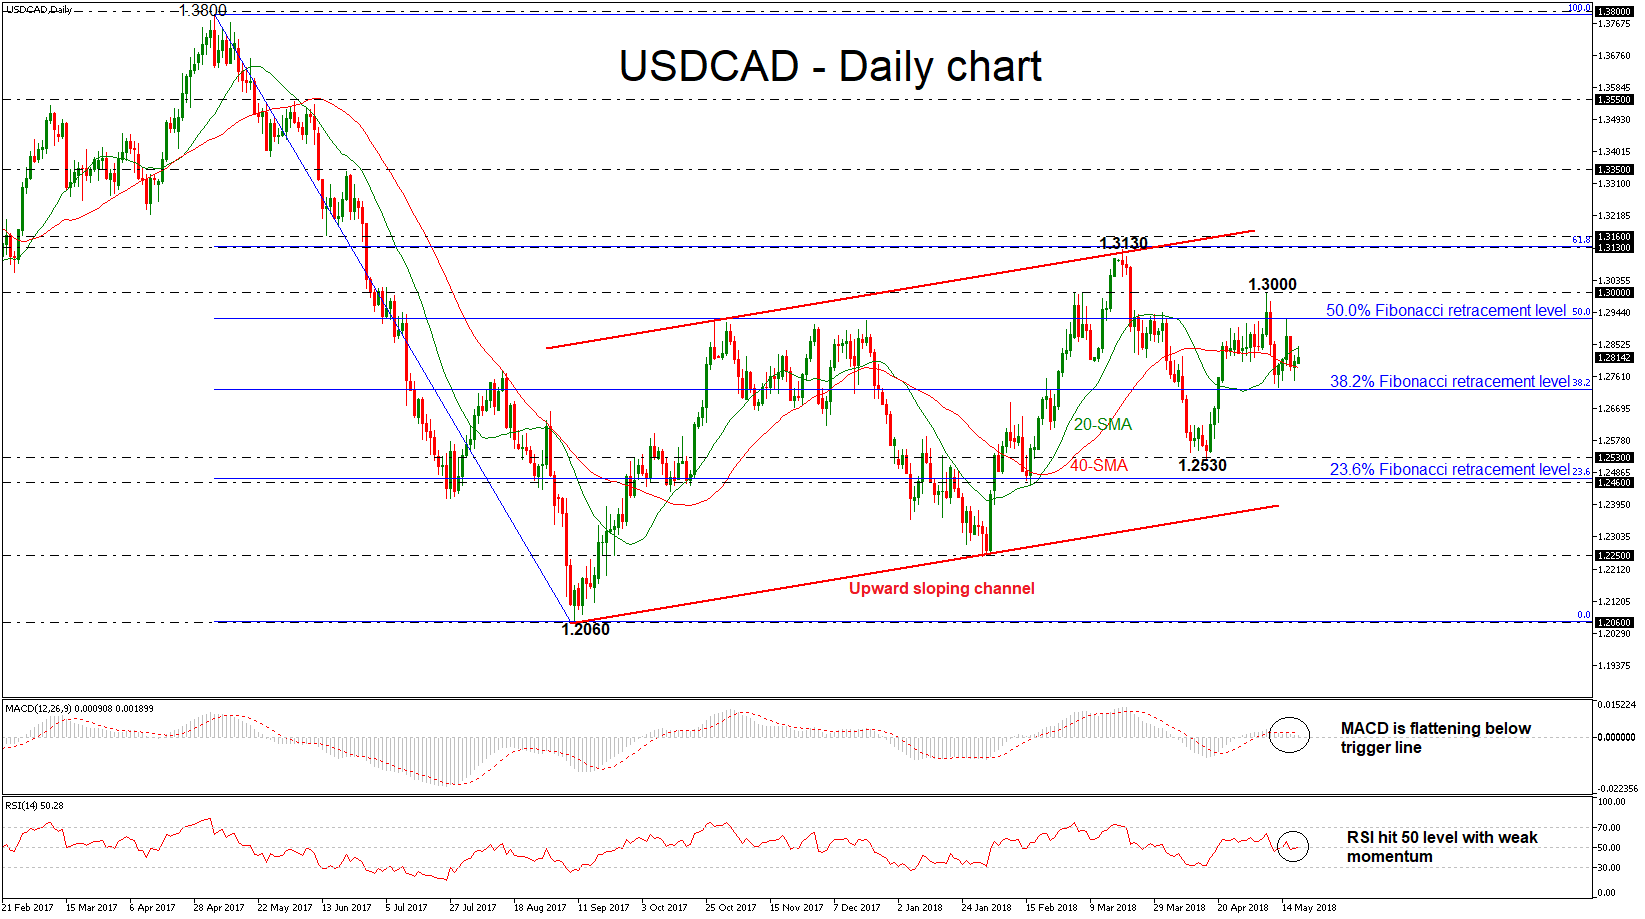
 USDCAD has been trading within the 20- and 40-day simple moving averages since Thursday’s session with weak momentum. The pair plunged below the 50.0% Fibonacci retracement level of 1.2925 of the downleg from 1.3800 to 1.2060 and is still holding above the 38.2% Fibonacci mark of 1.2725 during the current week.
Looking at the daily timeframe, based on technical indicators, momentum is too weak to provide a sustained move higher. The MACD oscillator slipped below its trigger line in the positive area, while the RSI indicator is standing near the 50 threshold and is sloping upwards.
Should prices move lower, immediate support could come at 38.2% Fibonacci level. A drop below this area would take the price to the next low of 1.2530 and significantly weaken the bullish medium-term structure.
In the event of an upside reversal, the 50.0% Fibonacci mark at 1.2925 could act as a barrier before being able to re-challenge the 1.3000 handle. A climb above this significant region would open the way towards the 1.3130 resistance level, taken from the peak on March 19, which overlaps with the 61.8% Fibonacci.
In the bigger picture, the pair has been developing within a rising sloping channel since September 2017, failing several times to exit from this range.
Origin: XM


