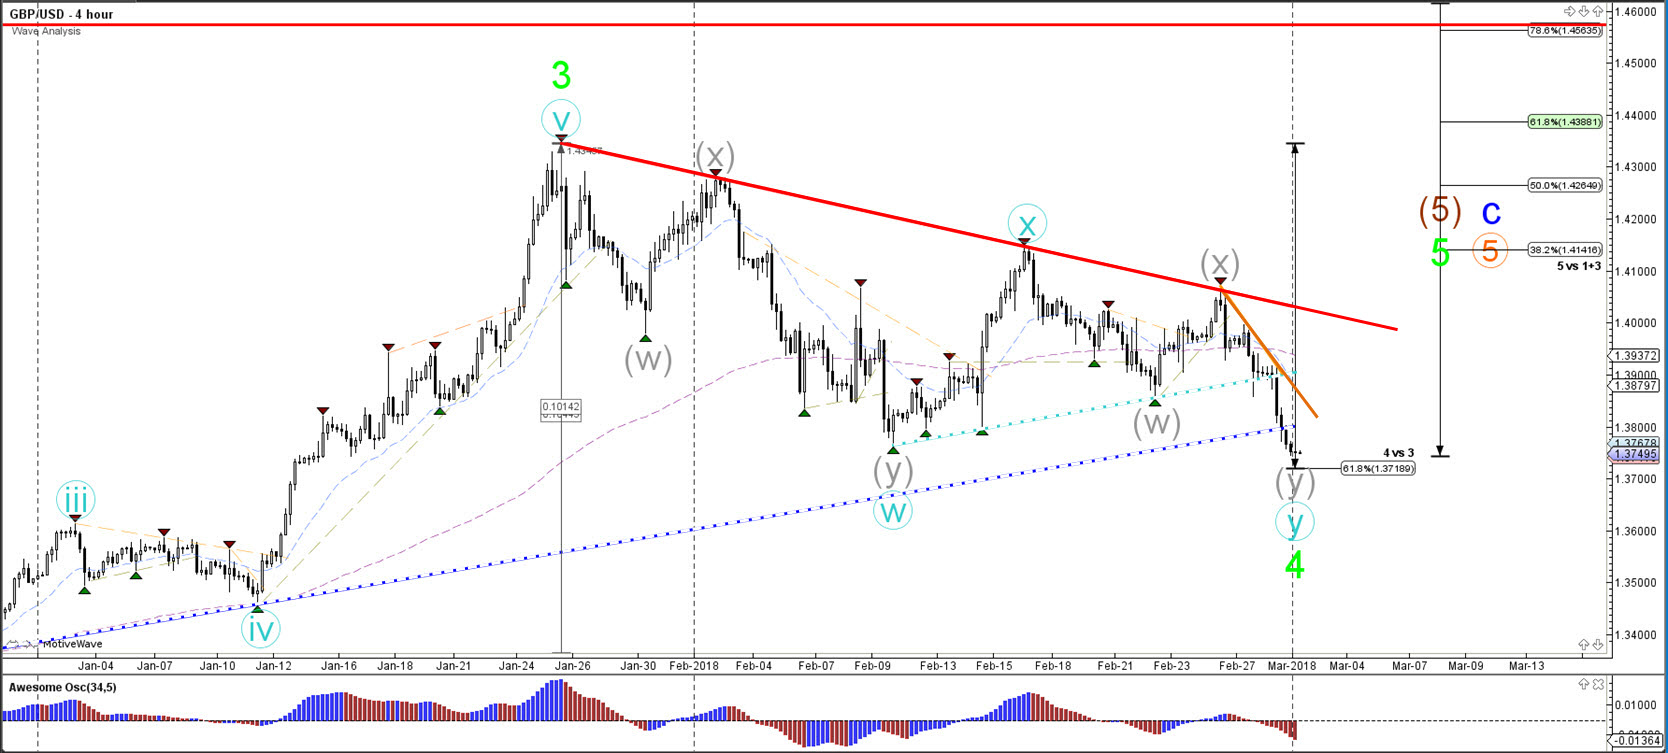
 4 hour
The GBP/USD broke below the support (dotted blue) of the triangle chart pattern and reached the 61.8% Fibonacci level. This Fib is a new bounce or break spot. A bearish break invalidates the wave 4 (green) pattern.
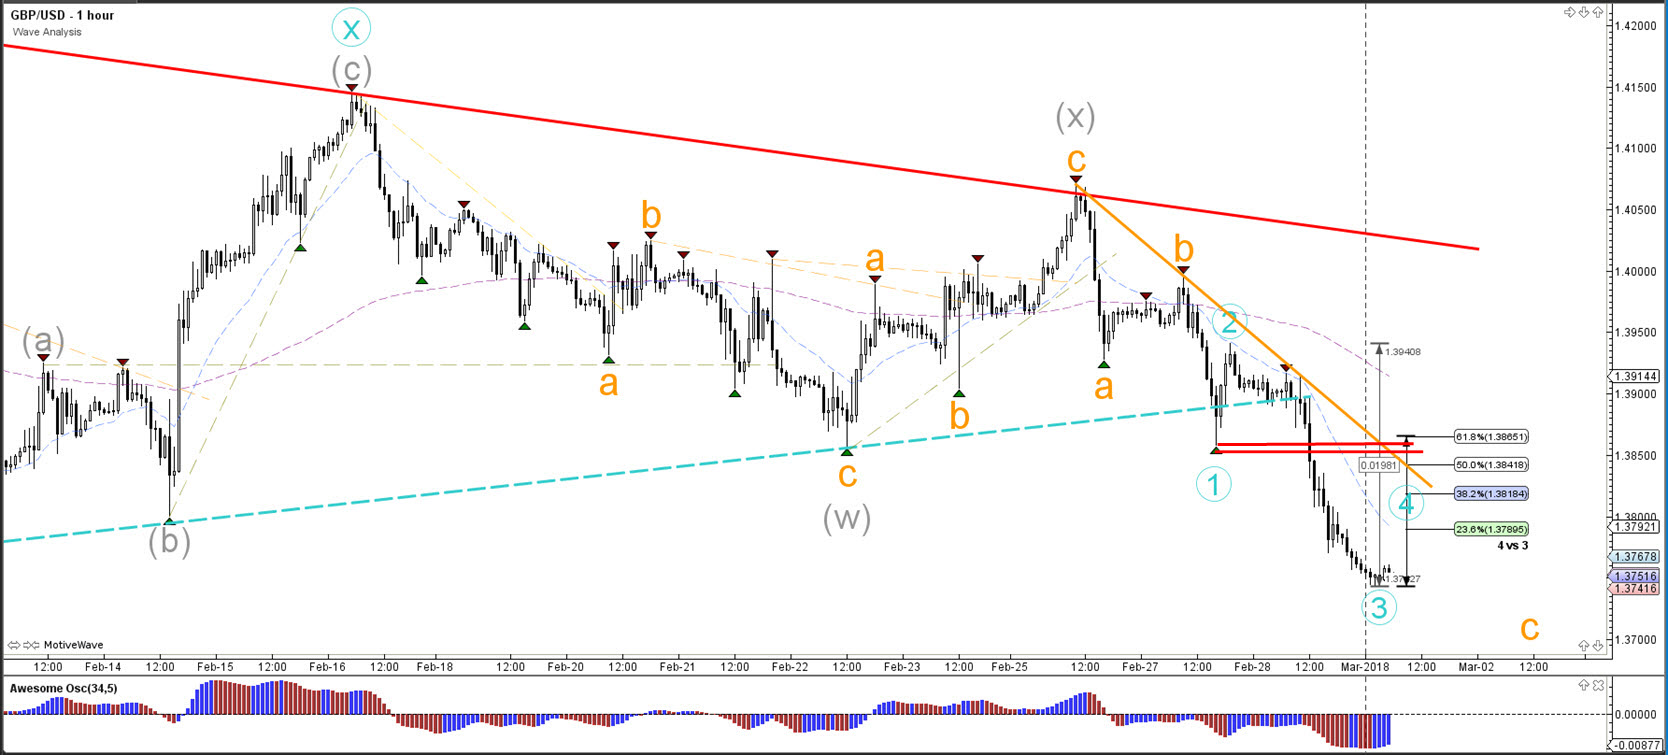
1 hour
The GBP/USD created strong bearish momentum yesterday which is most likely a wave 3 (blue), unless price breaks above the bottom of the wave 1 (red line).
4 hour
1 hour
Origin: Admiral Markets