


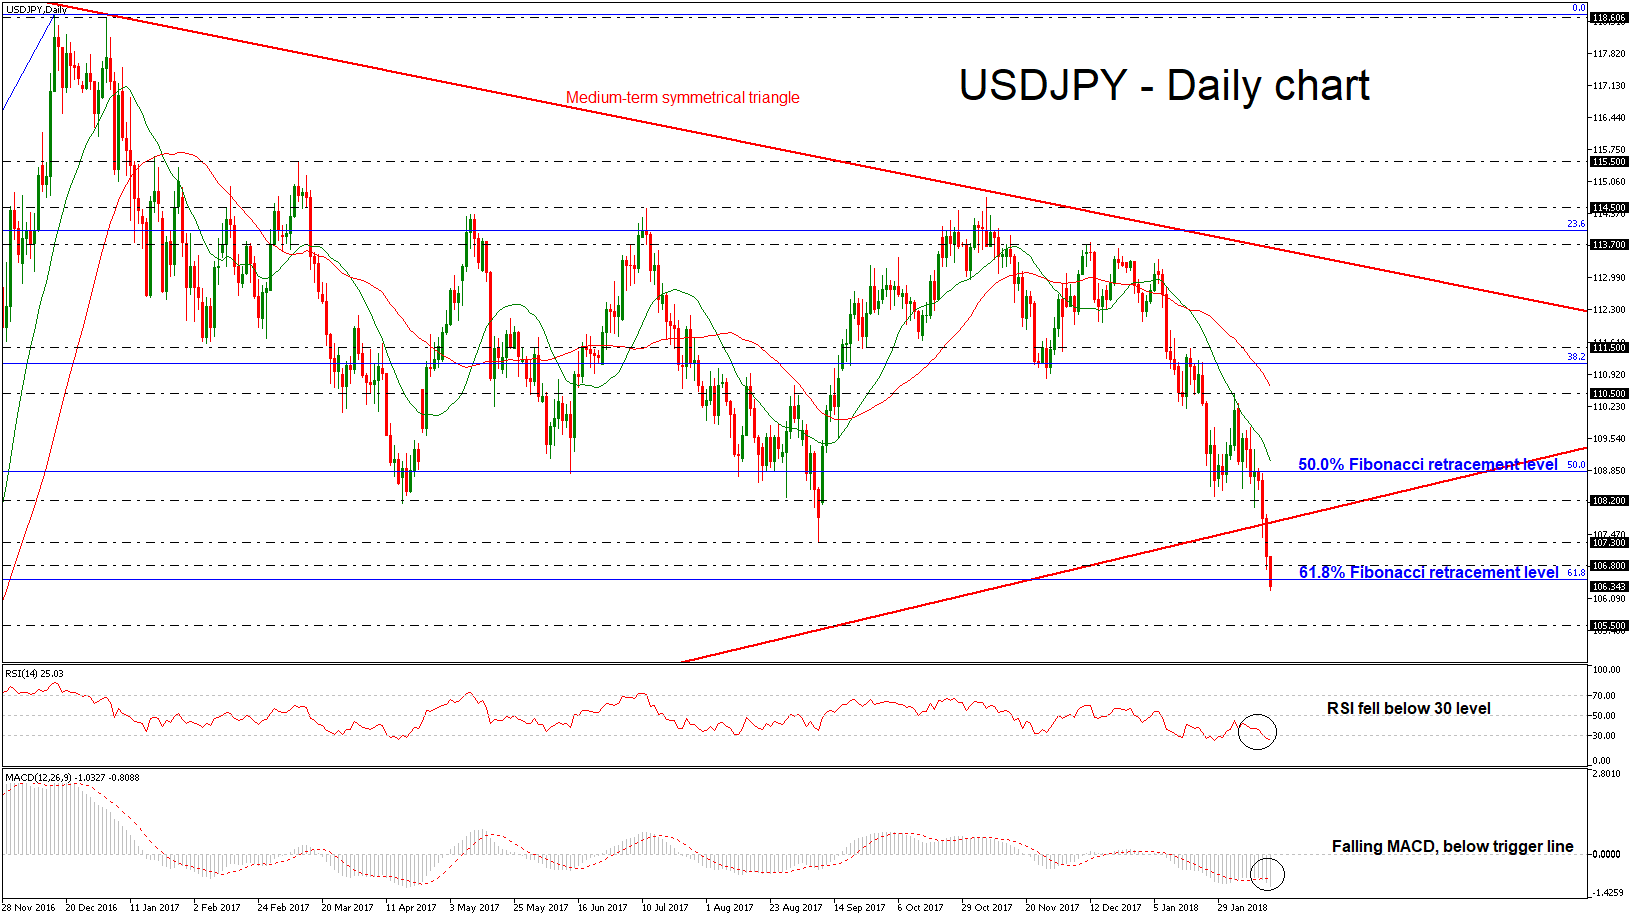
 USDJPY dipped sharply lower on Wednesday, while it posted the third red day in a row and created a new 15-month low of 106.29 during today’s Asian session. The aggressive bearish rally started after the fall below the 50.0% Fibonacci retracement level near 108.80 of the up-leg with the low of 98.96 and the high of 118.60 and drove the price below the symmetrical triangle, which has been holding since May 2015. A weekly close below the triangle could reinforce the downside pressure.
Short-term momentum indicators in the daily timeframe are also pointing to a continuation of the bearish bias. The Relative Strength Index (RSI) slipped below the 30 level and is challenging the oversold zone. Also, the MACD oscillator recorded a downside crossover with its trigger line with strong momentum, suggesting further losses.
If prices continue the sharp sell-off, immediate support could come at 105.50, which is taken from the high in October 2016. It is worth mentioning that the price has just hit the 61.8% Fibonacci retracement level near 106.50 and is ready to break it to the downside.
Conversely, in case of an upward correction, the pair needs to go through the medium-term ascending trend line and the 108.20 resistance level. A jump above the aforementioned levels, the price could open the door for the 110.50 obstacle.
Origin: XM


