


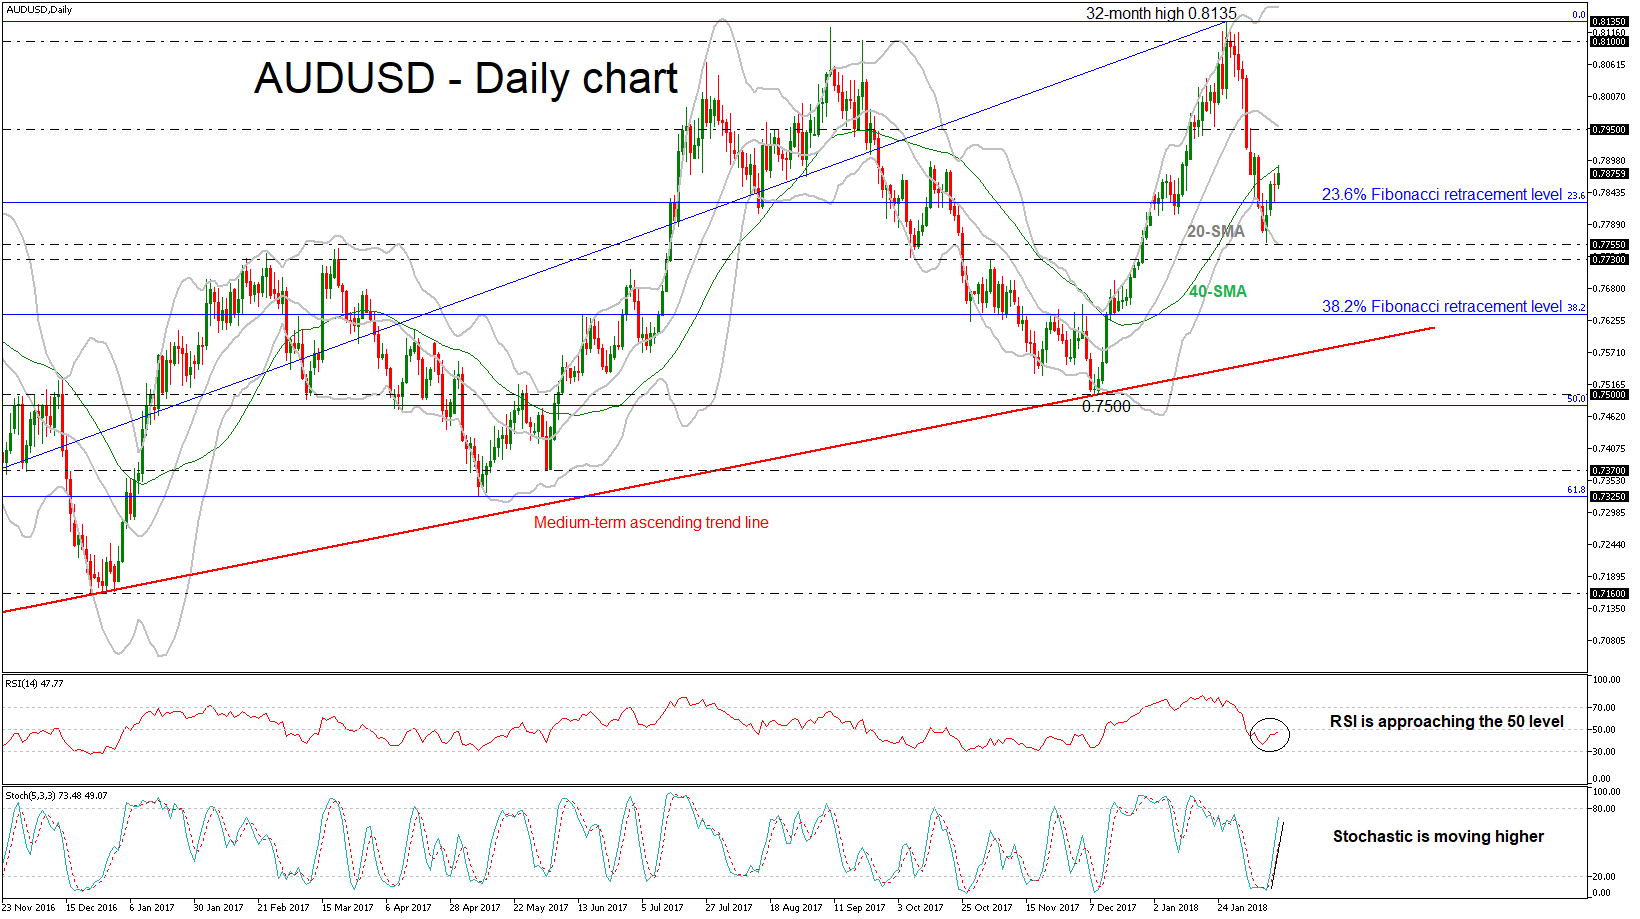
 AUDUSD has reversed back up again after finding support at the 0.7755 barrier, near the lower Bollinger Band. The price climbed above the 23.6% Fibonacci retracement level at 0.7826 of the up-leg with the low of 0.6820 and the high of 0.8100 in the medium-term timeframe.
Moreover, the downside pressure seems to be weakening, while the technical indicators are endorsing the bullish scenario. From the technical point of view, in the short-term timeframe, the RSI indicator is approaching the positive territory and is pointing north, while the stochastic oscillator is moving sharply higher slightly below the overbought zone. Also, the price has just hit the 40-day SMA near 0.7890.
Further gains could see the 0.7950 resistance barrier, which overlaps with the 20-day simple moving average. A jump above the aforementioned obstacle could reinforce the bullish structure in the short-term and open the way towards the next key resistance of 32-month high at 0.8135.
In the event of a downside reversal again, the 0.7730 – 0.7755 area could act as a critical barrier before being able to re-challenge the 38.2% Fibonacci mark around the 0.7635 level.
It is worth mentioning that AUDUSD has been developing within an ascending move since January 2016 and tested several times the diagonal line without slipping below it.
Origin: XM


