


 AUDUSD edged sharply lower over the previous six trading days, however, during yesterday’s session, the price snapped the steep losses and recorded a positive day, following the rebound on the lower Bollinger band around 0.7835.
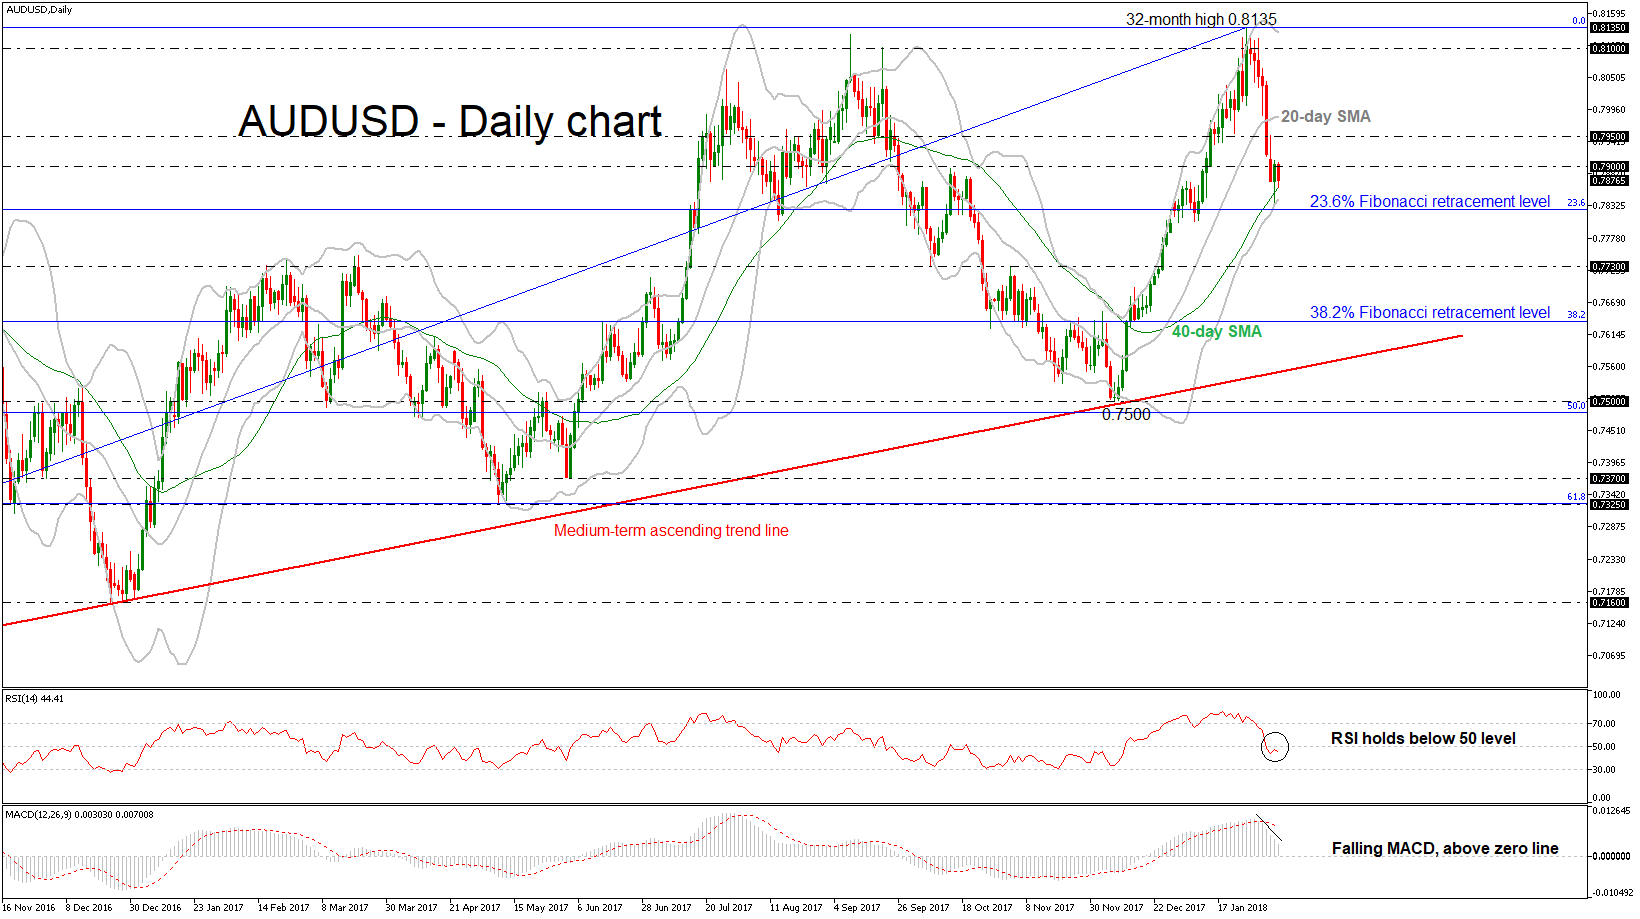
Looking on the bigger picture, the pullback from the 32-month high of 0.8135 endorsed the bearish phase, while the short-term technical indicators are bearish and point to more weakness in the market. It is worth mentioning that the price has been holding within an ascending move since January 2016.
From the technical point of view, in the daily timeframe, the RSI indicator is pointing to the downside in the negative territory, while the MACD oscillator is falling in the bullish area with strong momentum, both suggesting further downside correction in the near-term.
Wednesday’s session started with a bearish movement and if price action holds below the 0.7900 critical level, there is scope to test the 23.6% Fibonacci retracement level at 0.7825 of the medium-term up-leg with the low of 0.6820 and the high of 0.8135. Clearing this key level could see additional losses towards the 0.7730 inside swing barrier.
In the event of an upside reversal, the 0.7950 resistance level, could as a barrier before being able to re-challenge the 0.8100 significant psychological level. A break above this level could drive aussie/dollar towards the aforementioned 32-month high.
Origin: XM


