 4 hour
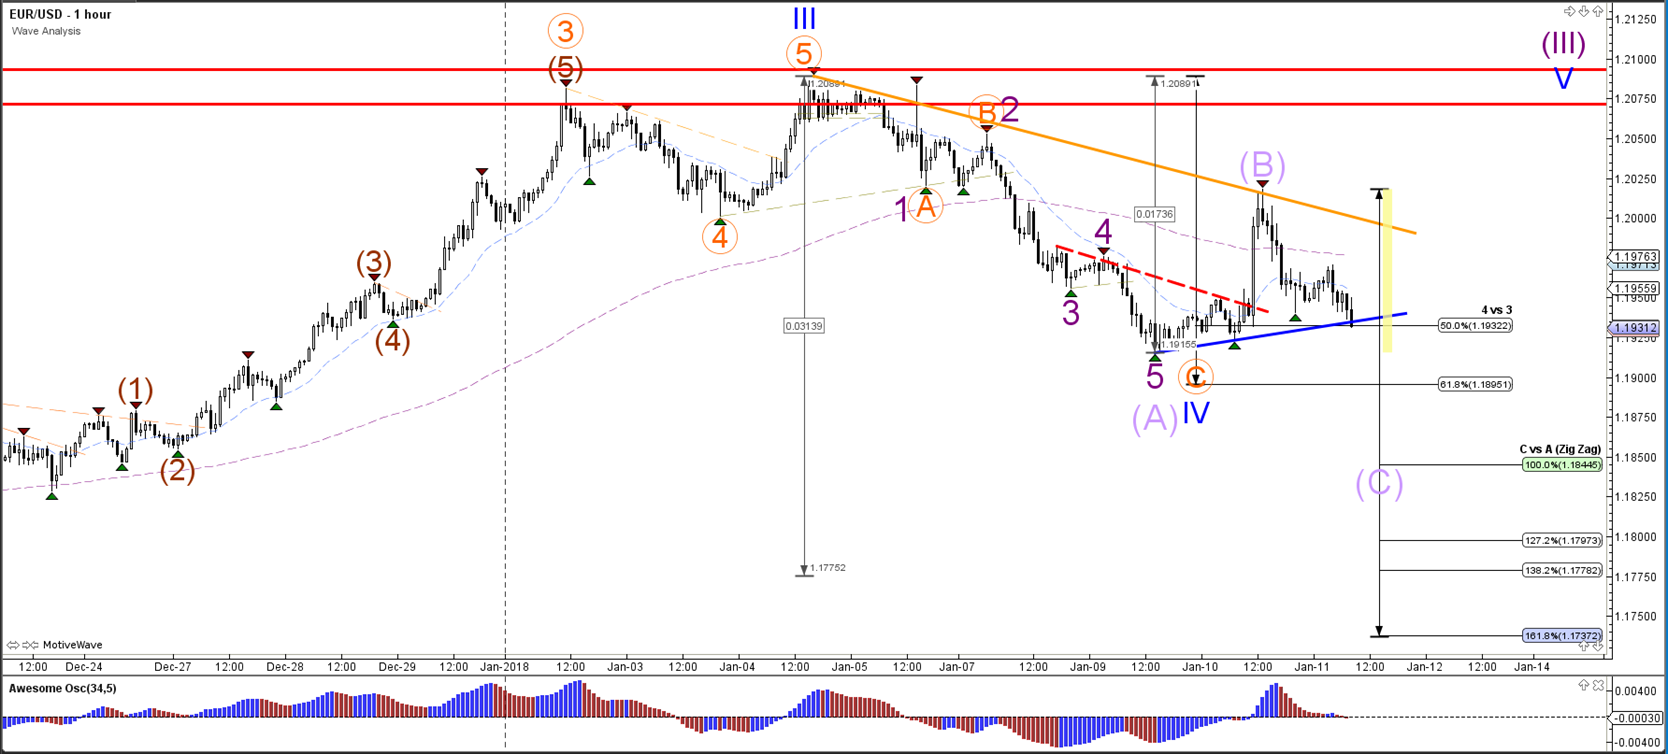
The EUR/USD is again challenging the Fibonacci levels of wave 4 vs 3 (blue) after bouncing at the 50-61.8% support zone. A break below the support trend line (blue) and 61.8% Fib of wave 4 makes a bearish scenario more likely. In that case, the alternative outlook is that price is not completing a 123 (pink) but a larger ABC correction (red).
1 hour
The EUR/USD broke the resistance trend line (dotted red) but failed to break above the next resistance (orange). Price is at a key bounce or break spot. A bearish break could indicate a larger bearish ABC (purple).
4 hour

1 hour
Origin: Admiral Markets