


 4 hour
The GBP/USD broke the support (dotted blue) of the corrective pattern. A break above the resistance trend lines (orange/red) could see price move towards the Fibonacci targets whereas a break below support (blue) could see price make a larger bearish reversal.
1 hour
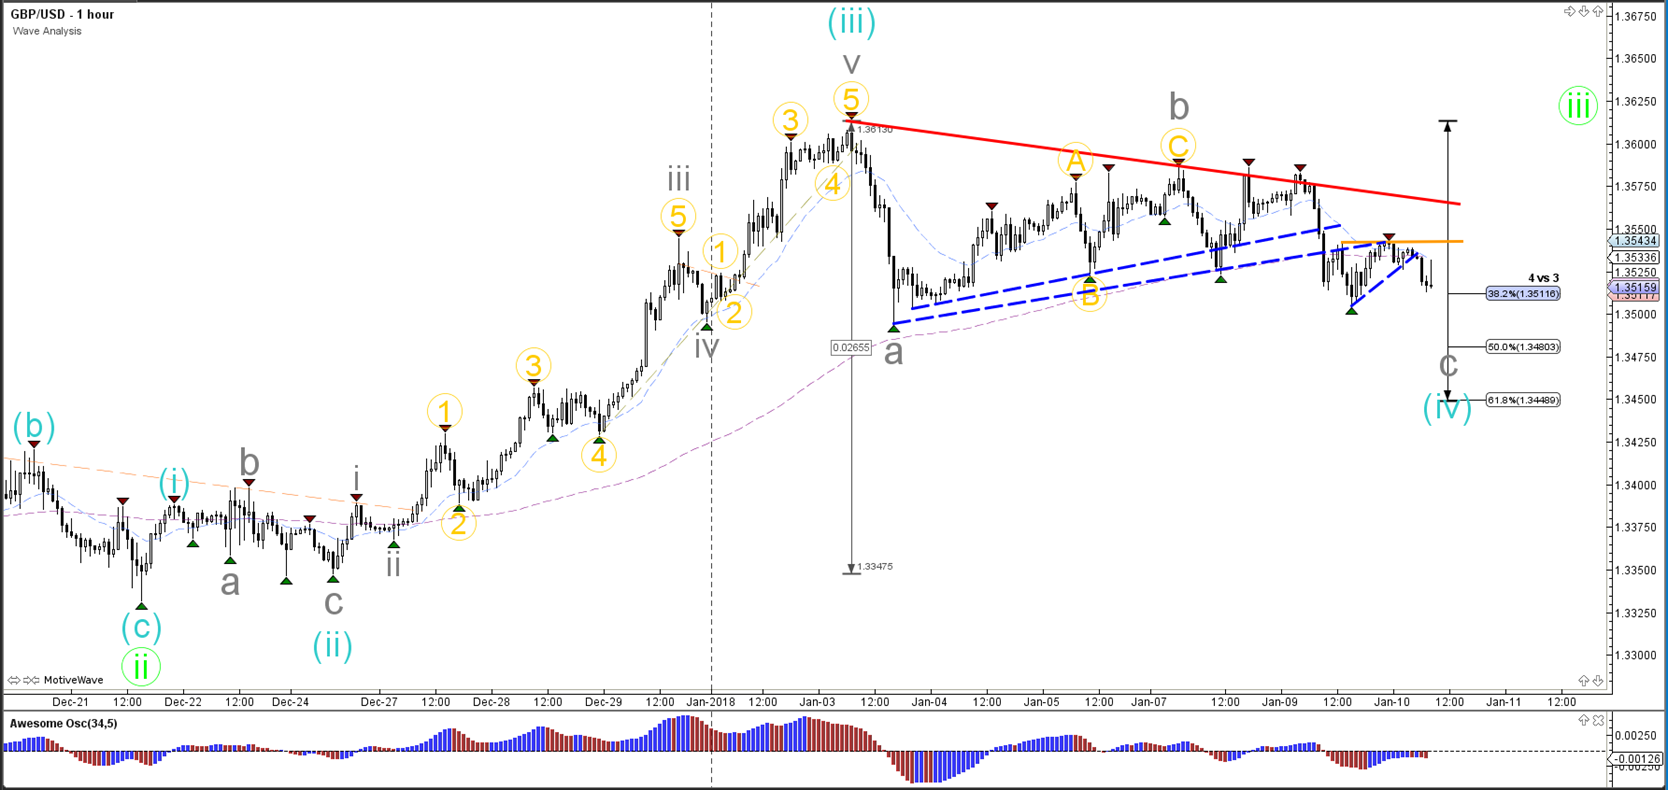
The GBP/USD broke multiple trend lines which could be part of ABC corrective pattern as long as price stays above the 50-61.8% Fib zone of wave 4.
4 hour

1 hour
Origin: Admiral Markets


