 4 hour
The EUR/USD broke the rising wedge chart pattern as mentioned in yesterday’s headline. Price broke below the support trend line during the FOMC statement and interest rate decision by the Federal Reserve in the US. The bearish fall is confirming the extended WXY (red) correction within wave 4 (blue).
The Fibonacci levels of wave Y (red) and wave 4 (blue) could act as potential support levels.

1 hour
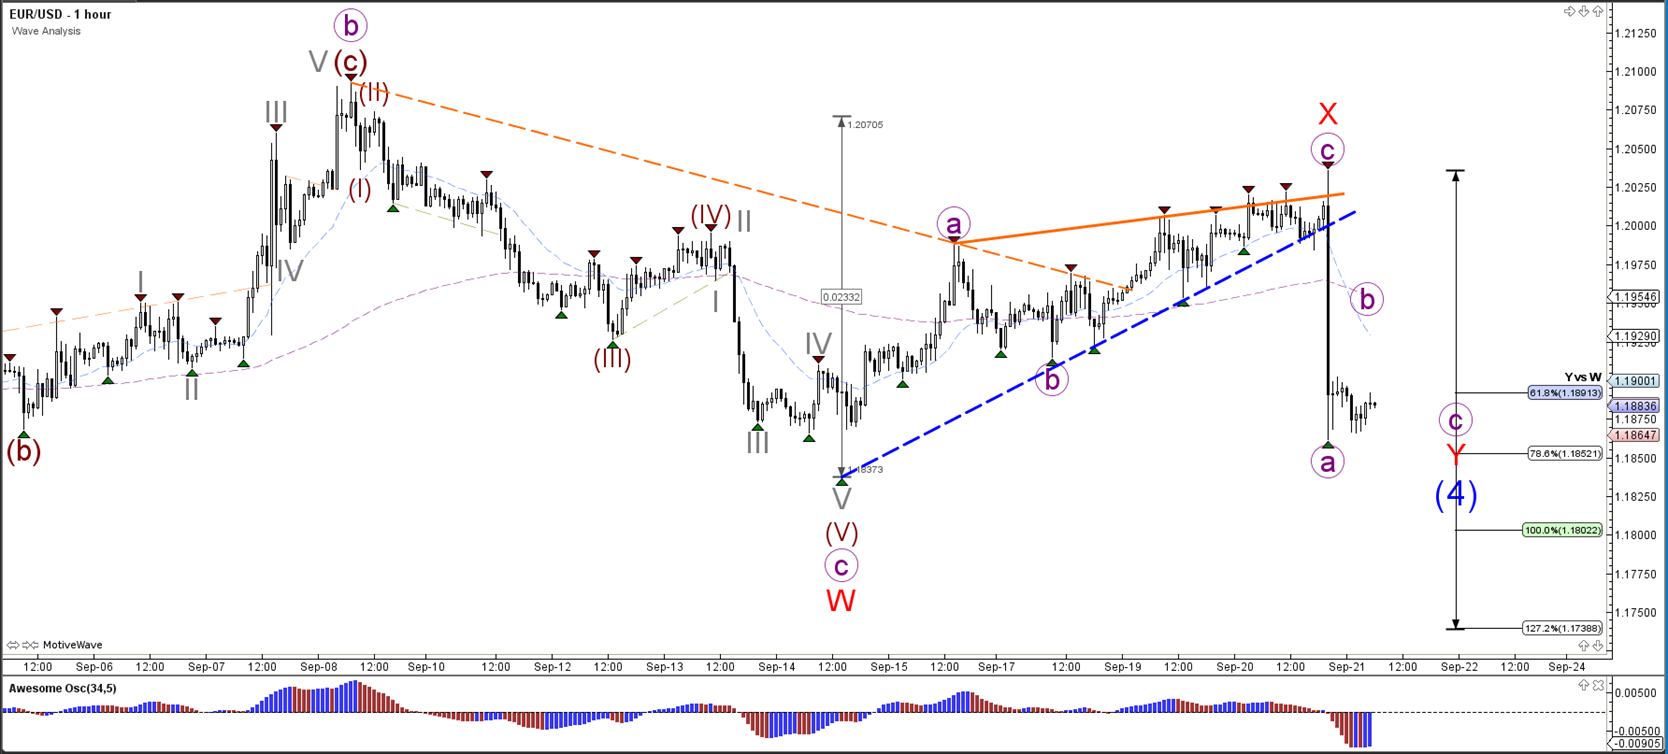
The EUR/USD break of the rising wedge chart pattern occurred with strong momentum and hence price could continue with its bearishness and build an ABC (purple) correction.