 4 hour
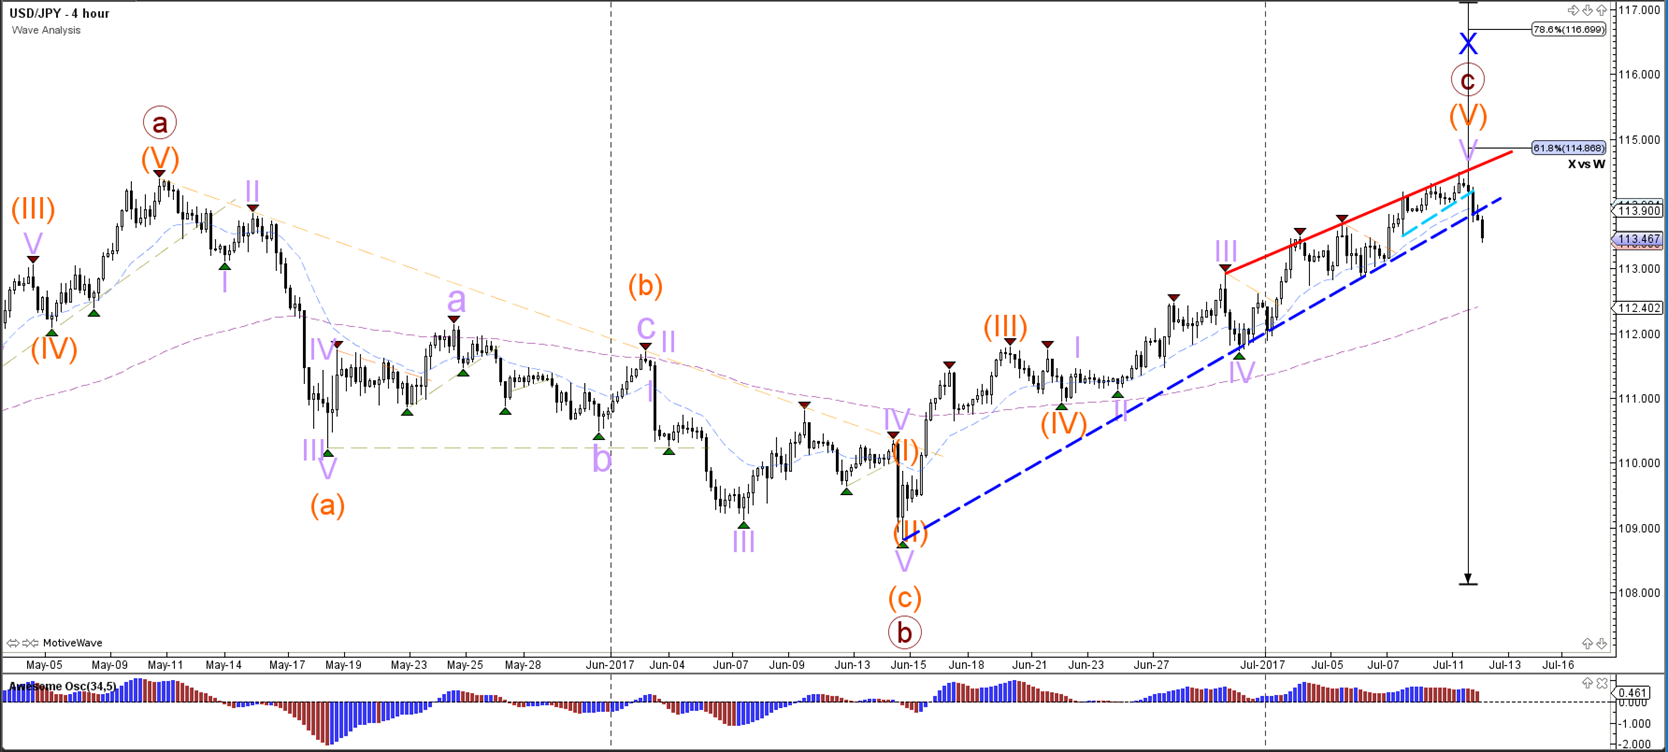
The USD/JPY broke the support trend lines (dotted lines) after approaching the 61.8% Fibonacci target and the 1.15 round resistance level.
The bearish break could confirm the completion of the wave X (blue), although it does depend on how price behaves on lower time frames as well.
1 hour

The USD/JPY break of the support trend lines (dotted blue) is showing a potential retracement or reversal. The latter scenario would indicate a potential wave 1 and 2 (orange) reversal.
Origin: Admiral Markets