 USDCAD is not much changed from where it started the day, while a successful close above the day’s open would mark the fifth consecutive day that the pair has done so.
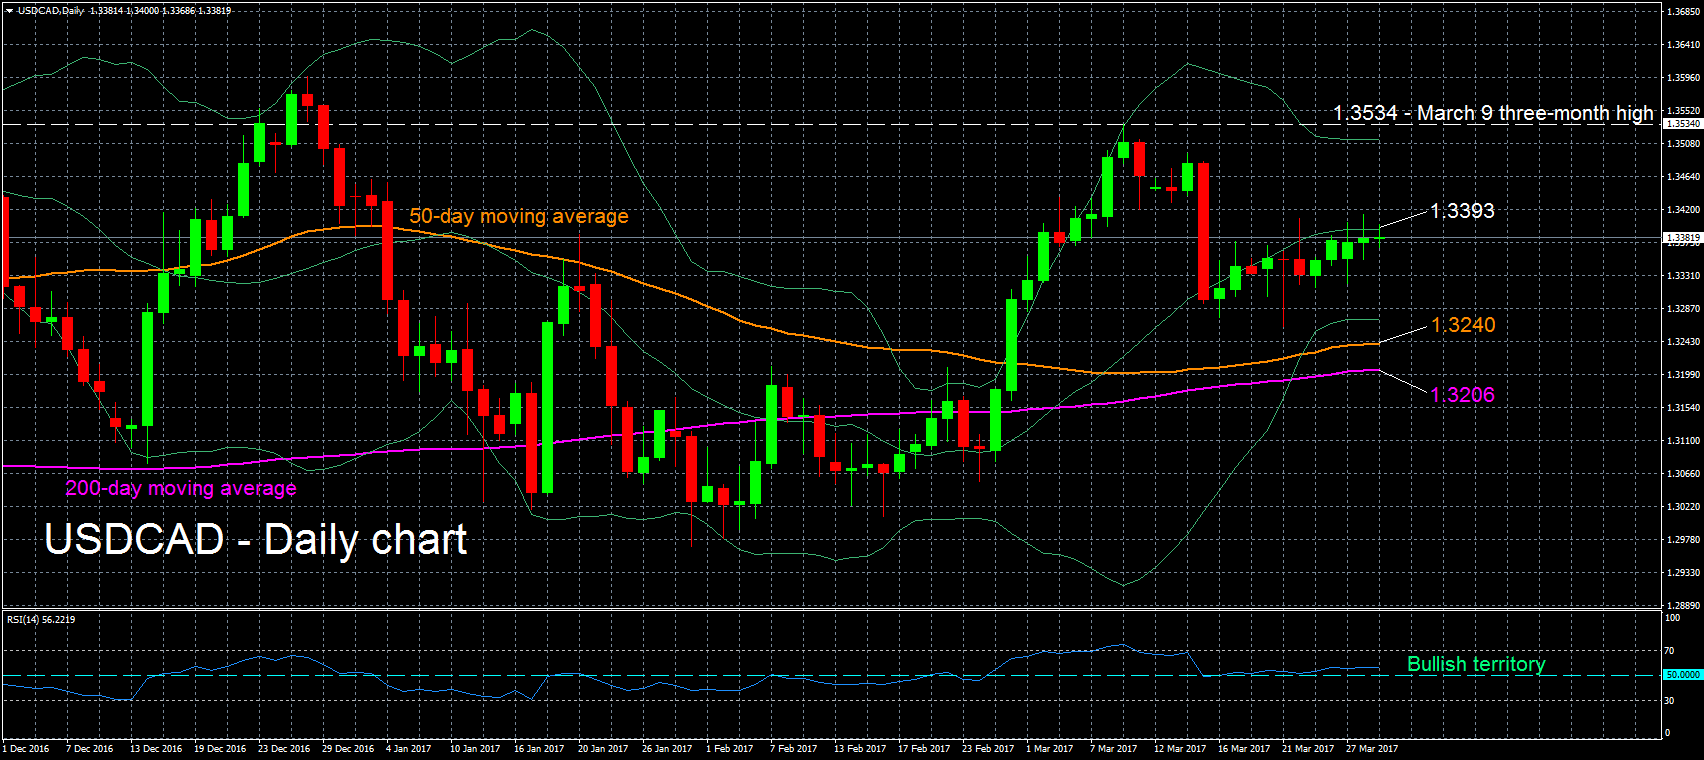
The short-term bias as depicted by the RSI is bullish as the indicator is at 56 after coming from neutral levels.
The price failed to close above the middle Bollinger line -a 20-day moving average (MA)- in the previous days and the line, currently at 1.3393, could act as resistance to upside moves in today’s trading. If it is breached, the upper Bollinger band at 1.3514, together with the March 9 three-month high of 1.3534, are likely to present another barrier to the upside for the pair.
If the price heads down, the lower Bollinger band at 1.3273, which roughly coincides with the March 21 four-week low, could offer support. If it fails to hold, the 50- and 200-day MAs at 1.3240 and 1.3206 respectively are expected to form an additional support area.
As regards the medium-term picture, the price being consistently above the 50- and 200-day MAs during the last month is indicative of the bullish outlook that is in place.
Summing up, the short-term bias is bullish as well as the medium-term outlook.
Origin: XM