 EURUSD is currently slightly up for the day after hitting a weekly high the previous day.
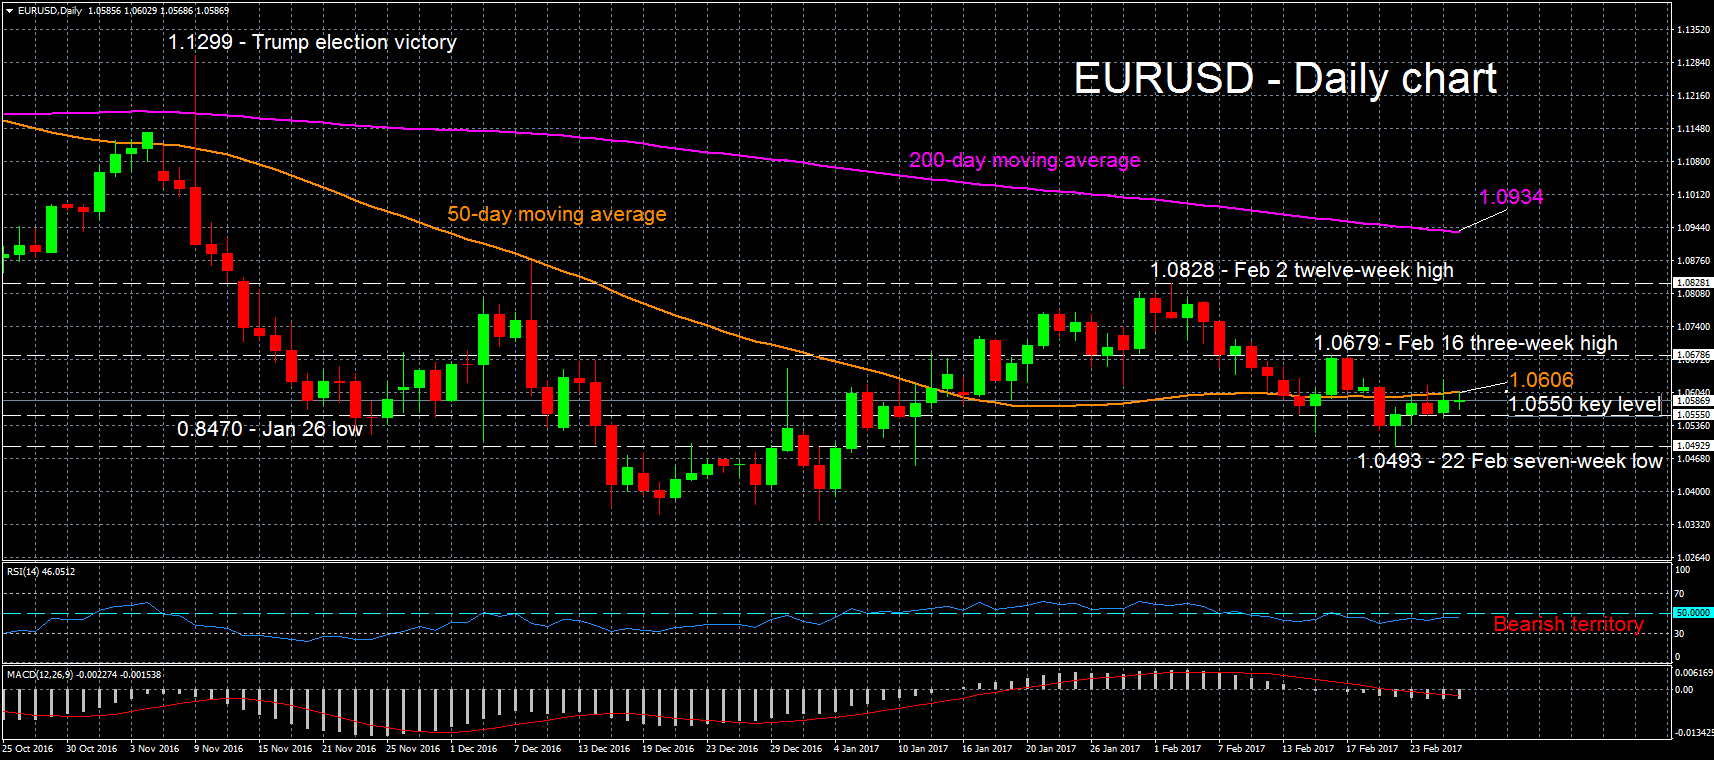
The short-term sentiment as depicted by the RSI is bearish as the indicator is below 50 at 46. The MACD indicator is giving a similar picture as the histogram is in negative territory and below the red signal line. Note though that RSI is fairly close to the 50 neutral level.
The 50-day moving average (MA), currently at 1.0606, is expected to provide resistance to upside moves (note that this is close to 1.06, a key level in the past). A break above would eye the February 16 near-three week high of 1.0679. Should this not hold as well, attention would shift to a likely much more significant resistance level, namely the February 2 near twelve-week high of 1.0828.
On the downside, the area around 1.0550 has resisted a daily close below it during the last trading days and it is likely to provide some support. Should it fail to hold, last week’s seven-week low of 1.0493 is expected to act as additional support.
Regarding the medium-term picture, if the price continues closing below both MA then this would be indicative of a bearish bias.
Overall, both the short- and medium-term outlook is looking bearish, though it might be argued only marginally given that RSI is close to 50 and the price not far below the 50-day MA.
Origin: XM