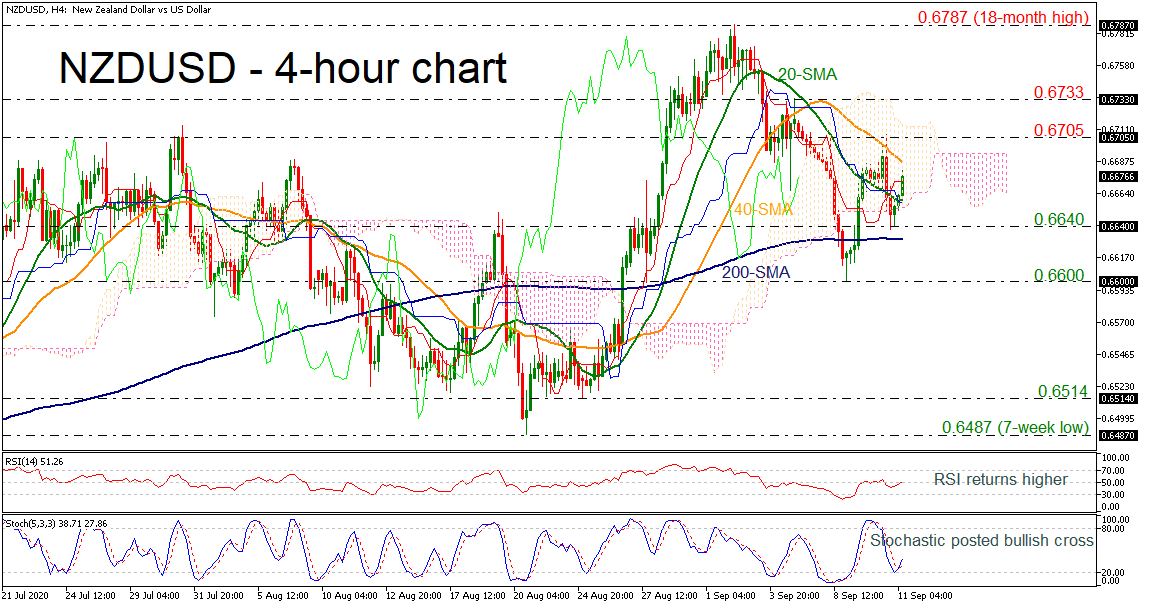
 NZDUSD looks to be creating a floor inside the Ichimoku cloud and above the 200-period simple moving average (SMA). The RSI indicator is ticking marginally up near the neutral threshold of 50, while the stochastic posted a bullish crossover within its %K and %D lines following the bounce off the 20 level.
Traders, however, would be more eager to engage in buying activities if the price manages to surpass the nearby 40-period SMA at 0.6687. If this is successfully breached, then the rally may next rest somewhere near the 0.6705 barrier, while a closure above it may be needed to push the price towards the 0.6733 resistance and the 18-month high of 0.6787.
On the flip side, the selling pressure could accelerate if the market deteriorates below the cloud and the 20-period SMA. Such a move could next bring the 0.6640 key barrier under the spotlight, which if violated could trigger sharper losses probably towards the 200-period SMA at 0.6630 and the 0.6600 round number. More downside pressure could open the door for the 0.6514 support.
In the medium-term timeframe, the pair is in a bullish trend since March, though in the short-term timeframe, the price needs to overcomes the 0.6787 hurdle to shift the outlook back to a bullish one.
Origin: XM