


 Crude oil continues to establish a well-defined downtrend, forming consecutive lower swing highs and lower swing lows. The sequence of moving averages, from short to long-term, remains downward sloping, and crude continues to trade beneath all of them — a clear sign of prevailing bearish momentum.
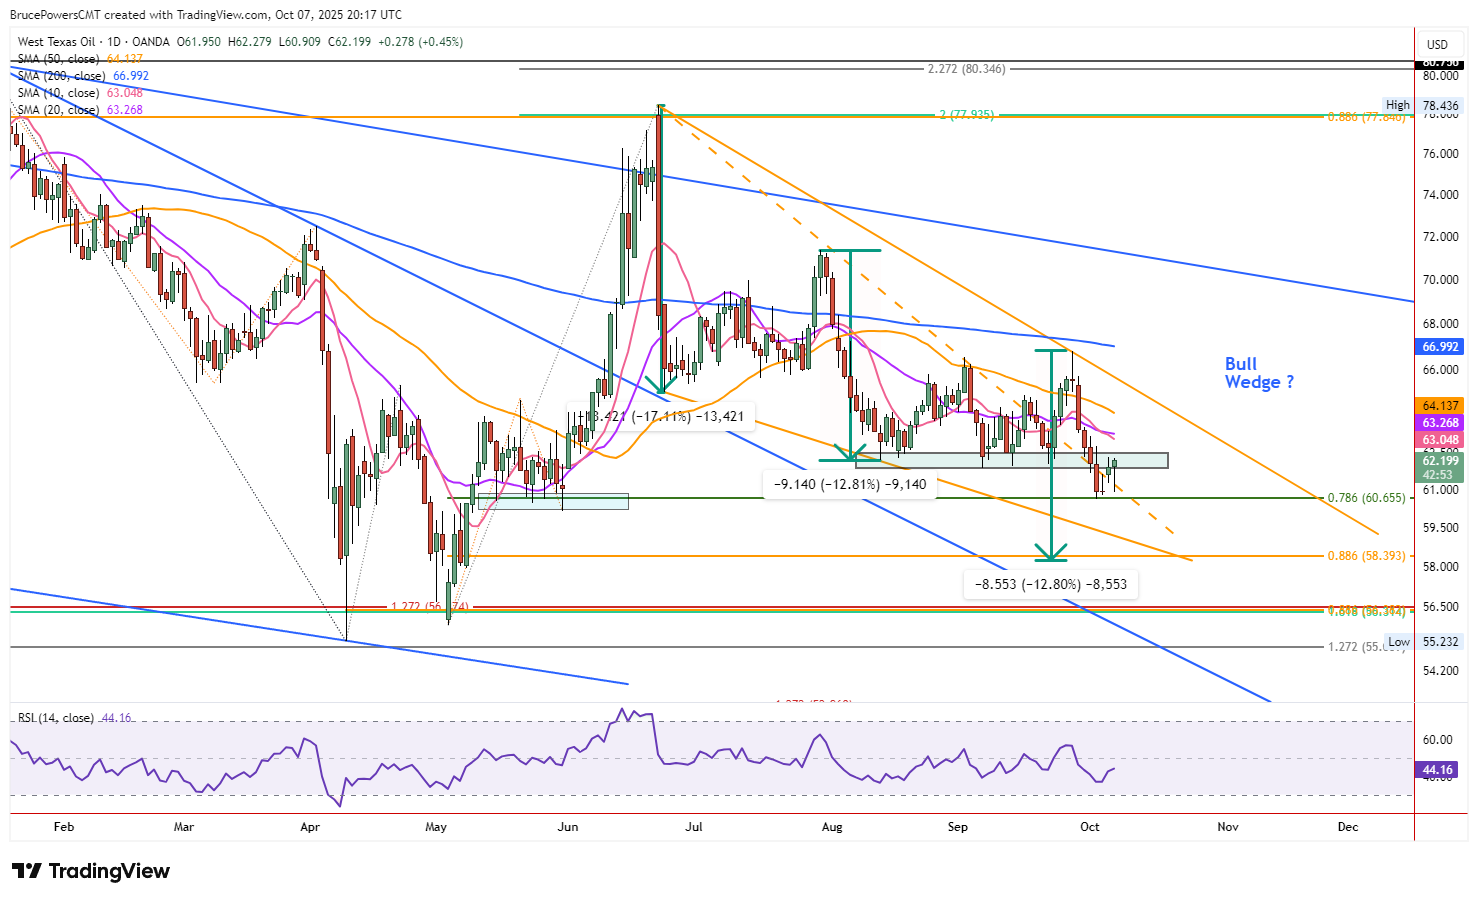
Last week’s break below the key support zone from $62.47 to $61.84 confirmed a structural shift lower. So far this week, crude has retested that prior support as resistance. Monday’s high of $62.32 marked a successful test of the top of that zone before renewed selling pressure emerged. By Tuesday, oil printed a lower daily high at $62.23 and a lower low at $60.91, reinforcing the bearish bias.
Failed Wedge and Bearish Continuation
A falling bullish wedge pattern had been developing, with a breakout attempt occurring on September 23. However, after briefly reaching a seven-week high, the breakout failed as sellers regained control. The pattern has since expanded, forming a broader upper boundary connecting the September 26 lower swing high. That move triggered renewed downside momentum, taking prices to a fresh trend low of $60.64 last Thursday.
The decline completed a 78.6% Fibonacci retracement at $60.66, an area now acting as tentative support. A minor counter-trend bounce followed to $61.24, but Tuesday’s reversal near that level signals renewed weakness and a potential continuation of the downtrend.
Watching for a Test of Deeper Support
If crude closes decisively below $60.64, attention shifts toward the 88.6% Fibonacci retracement near $58.39 — a zone that also aligns with a prior bearish measured move target around $58.29. Matching the previous 12.8% decline from the July swing high to this zone strengthens its technical significance.


