 Oil prices rebounded on Wednesday following a larger-than-expected drop in US crude inventories. The chart below shows that US crude oil stockpiles dropped by 6.014 million barrels for the week ended August 15, 2025, according to data from the EIA.
Brent crude oil (BCO) formed a bottom at $65.50, while WTI crude oil (CL) rebounded from $61.50. The previous day saw losses in the oil market amid optimism over Ukraine peace negotiations. However, lingering uncertainty and conflicting statements from involved parties kept market conditions volatile.
Moreover, comments from Donald Trump added to the uncertainty. While he ruled out sending US troops to Ukraine, he hinted at possible air support. Meanwhile, Russia warned that excluding Moscow from security talks was “a road to nowhere.” Any breakthrough could lead to sanctions relief and increased Russian oil exports, potentially pressuring prices.
Meanwhile, oil flows between Russia and Asia remain active. India has resumed purchases of discounted Russian crude for fall delivery, despite new US tariffs. Russia confirmed its ongoing supply to India and called for trilateral talks with China. This backdrop of steady demand and restricted supply continues to support oil prices, even as the Russia-Ukraine conflict unfolds.
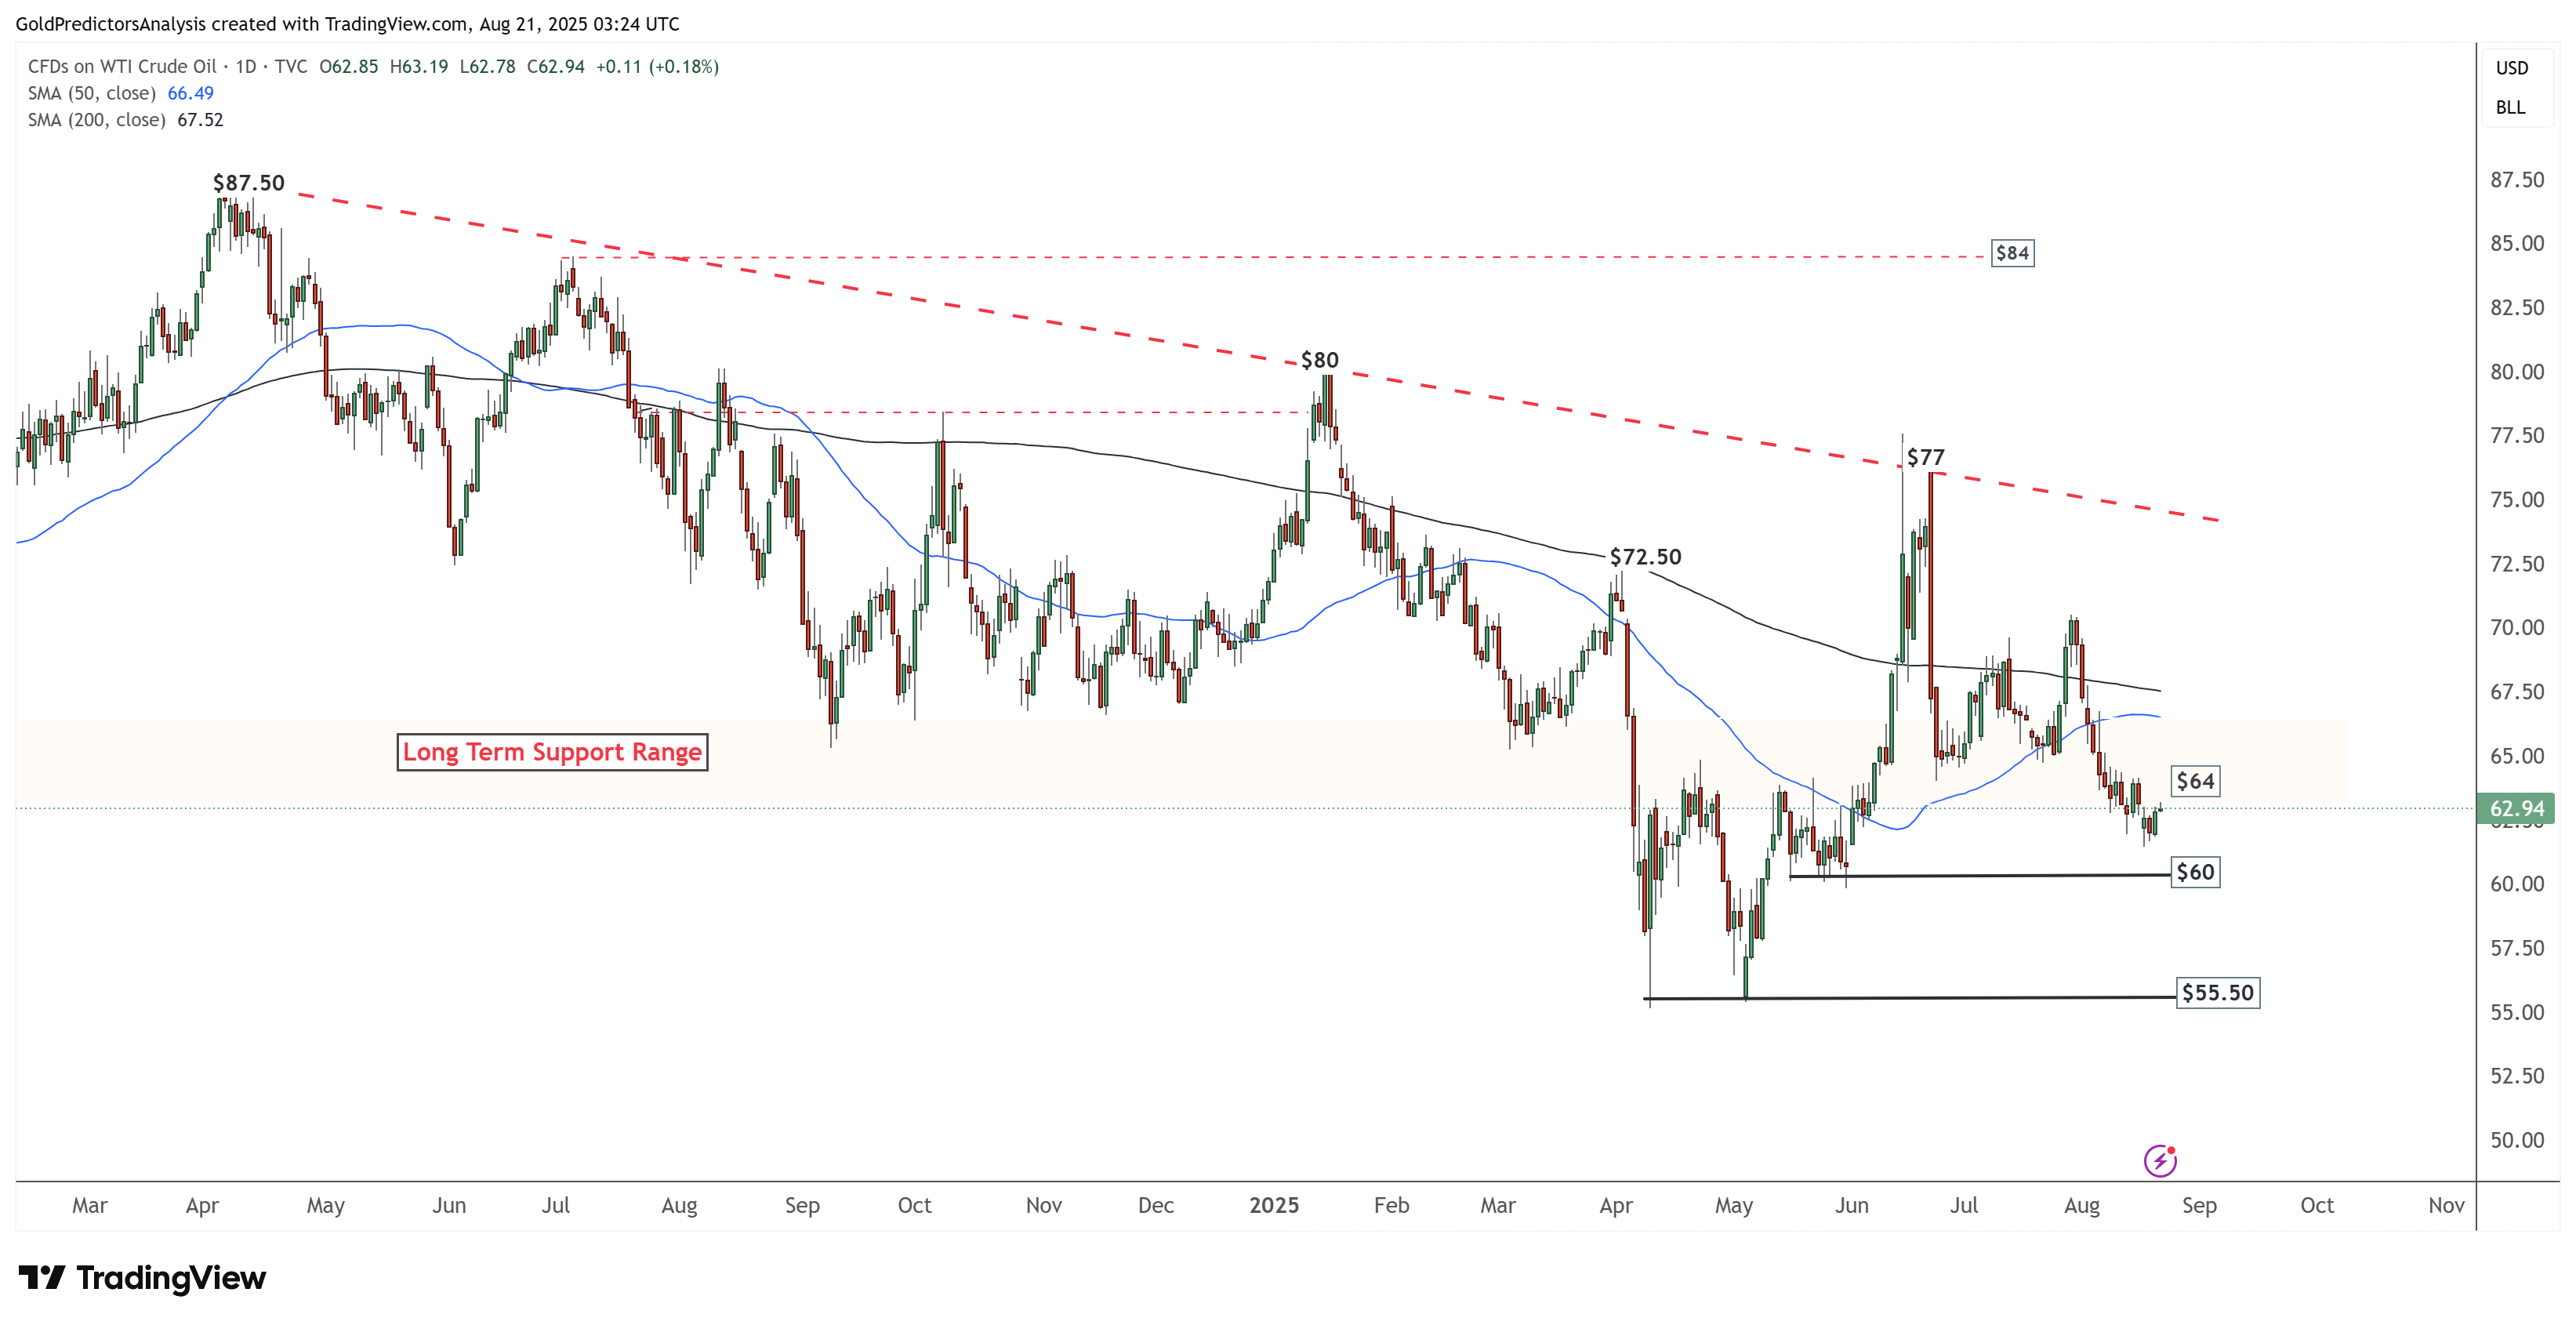
WTI Oil Daily Chart – Bearish Pressure
The daily chart for WTI Crude Oil shows price uncertainty within a broader bearish trend. Prices are attempting a rebound from current levels toward the $64 resistance zone. However, the 50-day SMA remains below the 200-day SMA, indicating continued negative momentum.
Immediate support lies near the $60 level. A break below this area could push oil prices further down toward the $55.50 region. On the upside, a break above $64 may open the path toward the $68–$70 range.
Despite the current rebound, the bearish structure remains intact. The downward-sloping moving averages reinforce the likelihood of further downside pressure.
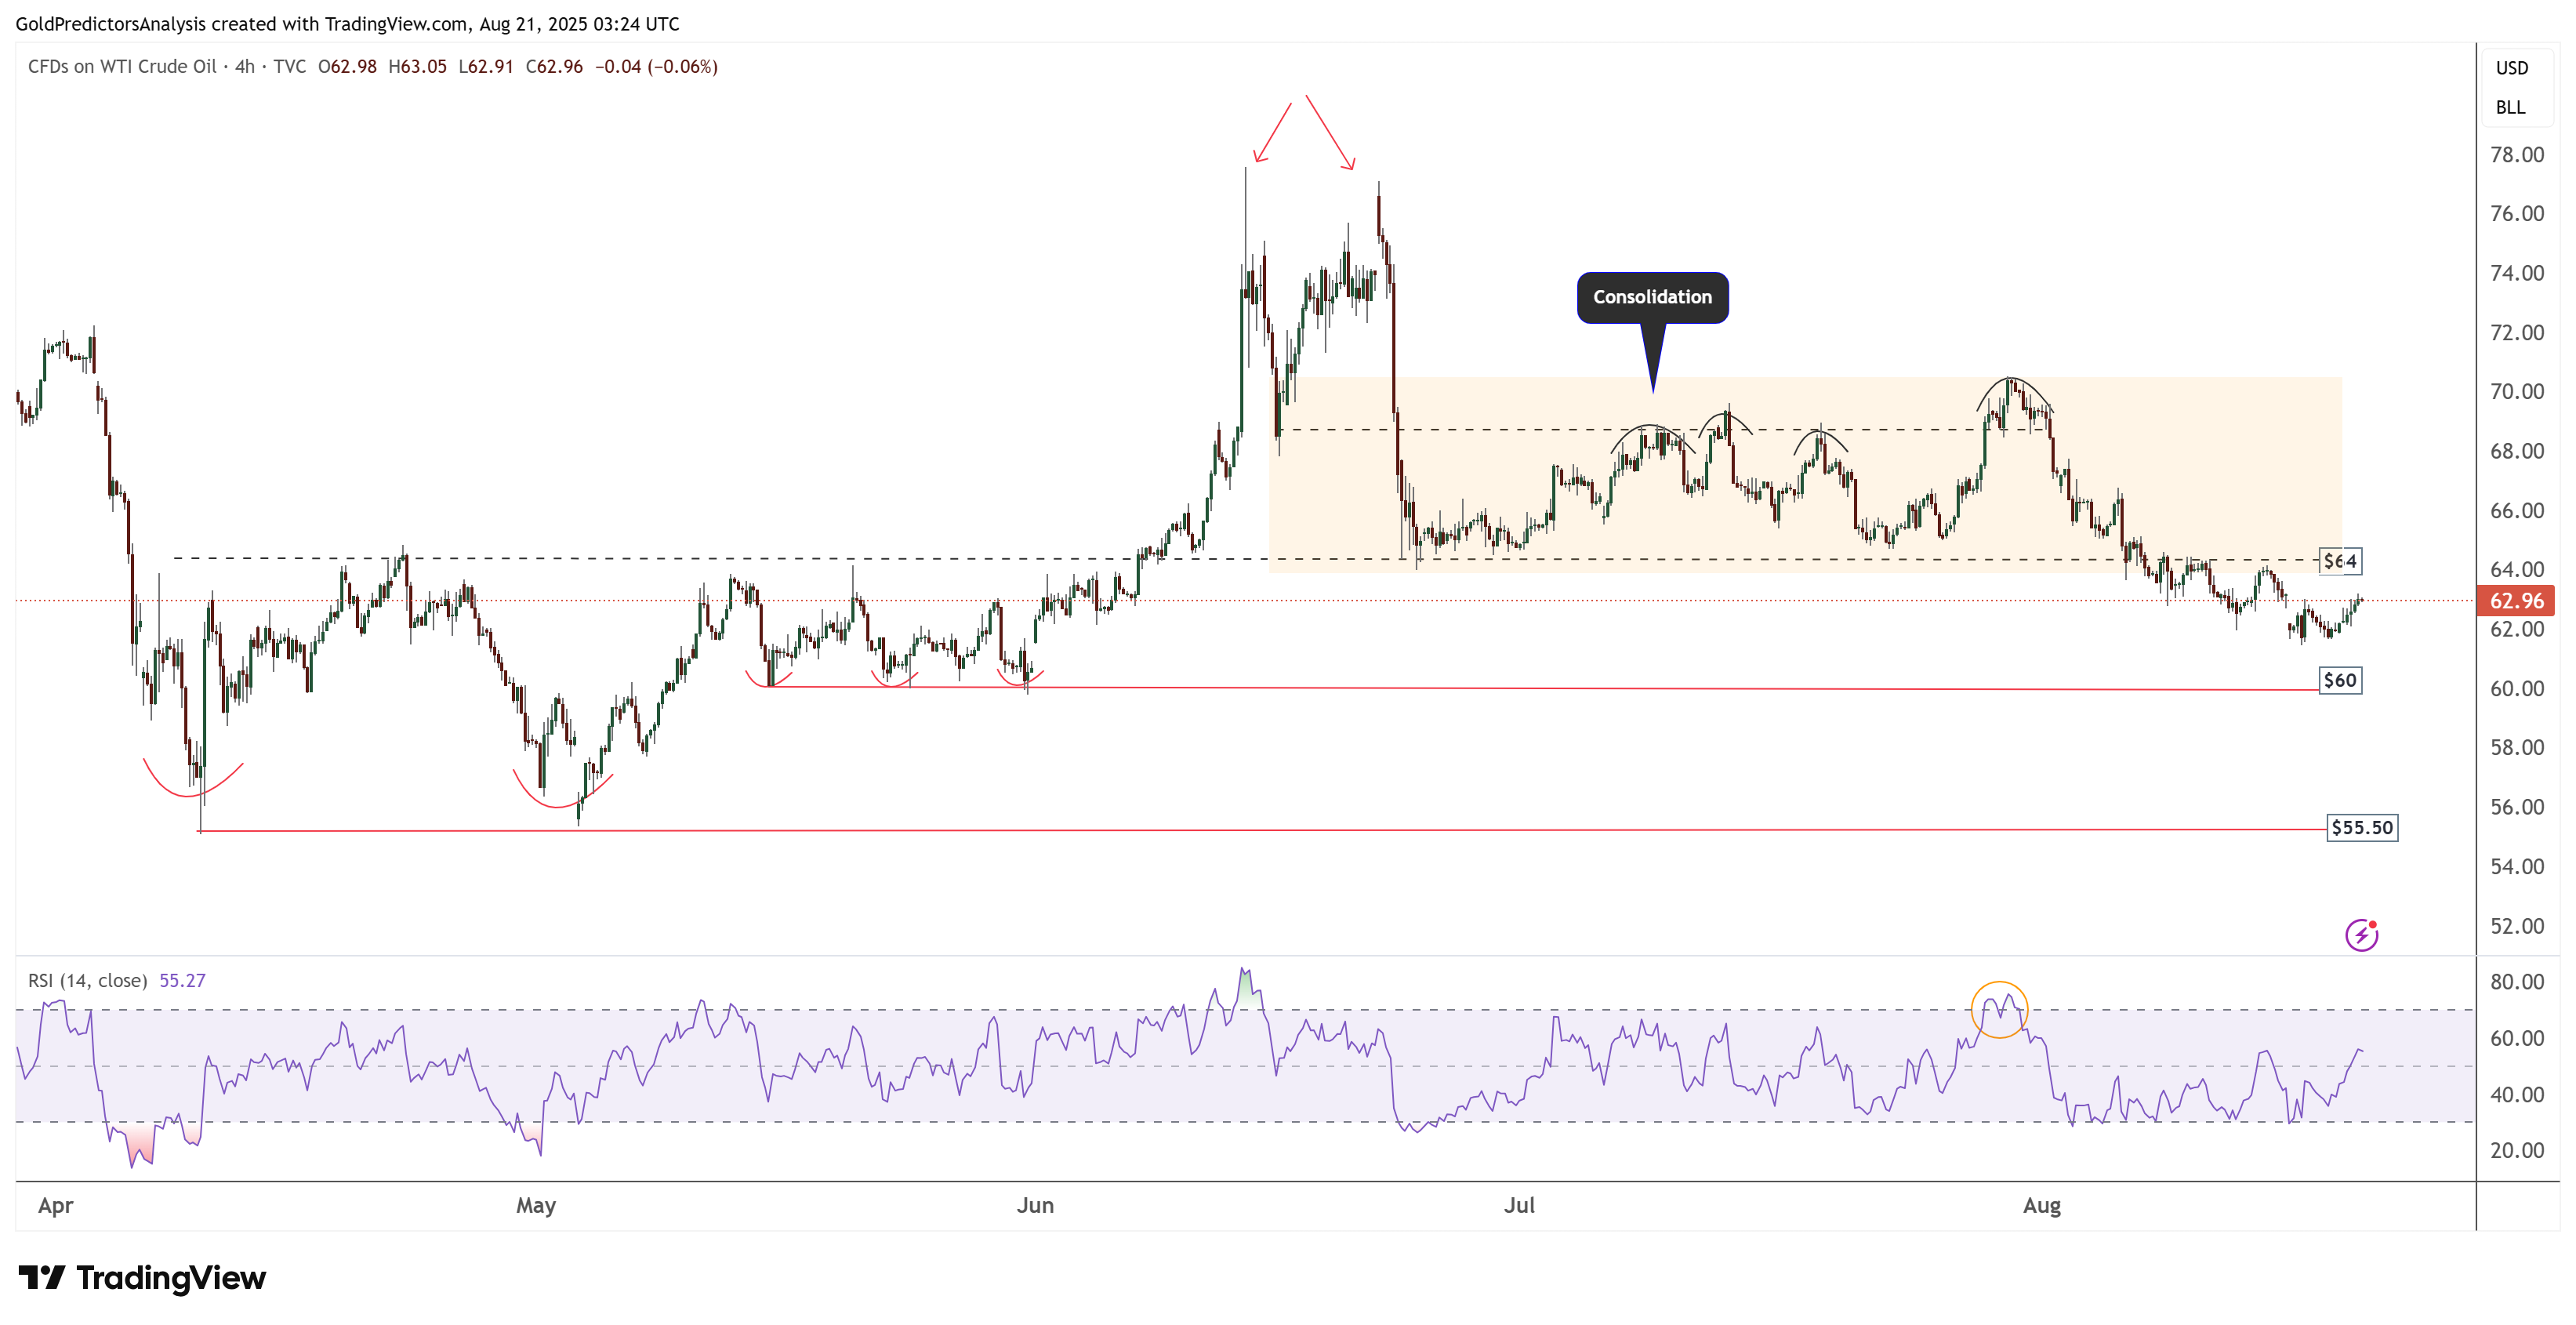
WTI Oil 4-Hour Chart – Consolidation with Bearish Bias
The 4-hour chart for WTI crude oil shows bearish pressure on prices. This pressure is reflected in the double top pattern formed in June, followed by a prolonged consolidation phase in July. The July consolidation eventually broke the $64 support, reinforcing the bearish outlook.