 WTI Oil Daily Chart – Bearish Pressure
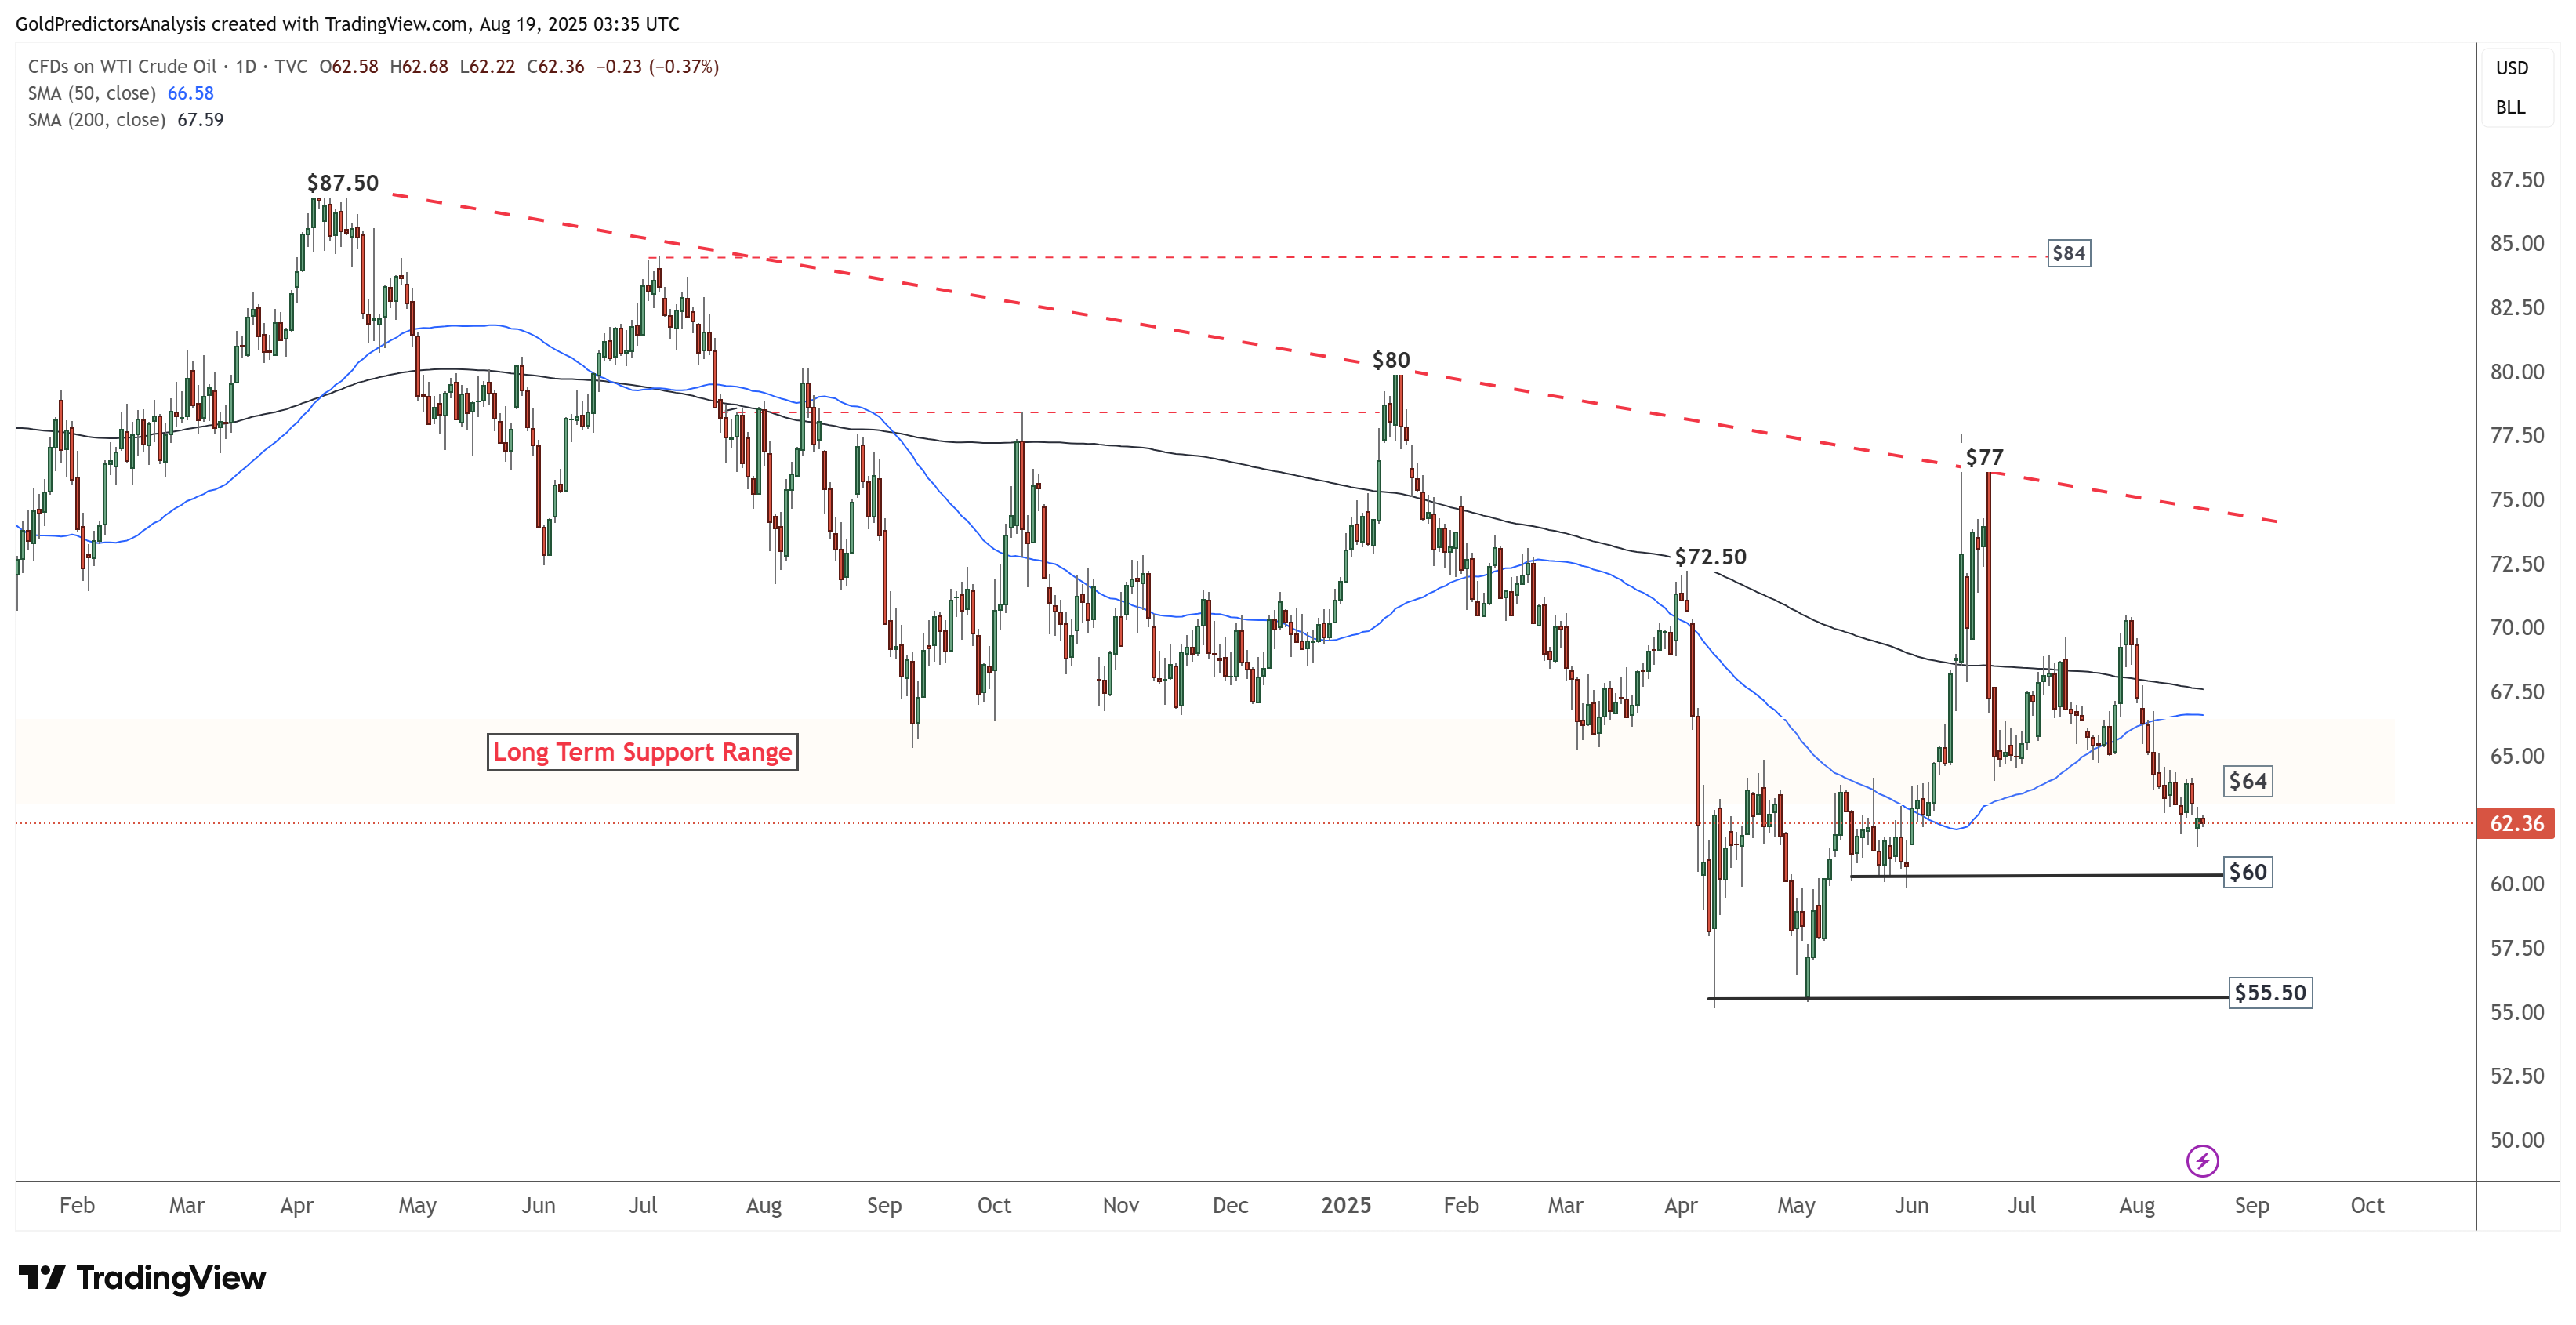
The daily chart for WTI crude shows negative price action below the $77 area. Immediate support lies at $60 and $55.50, while the 50-day SMA remains below the 200-day SMA, confirming bearish momentum. A break below $55 will trigger strong selling pressure in the oil market. However, a breakout above $70 is needed to ease the short-term bearish pressure.
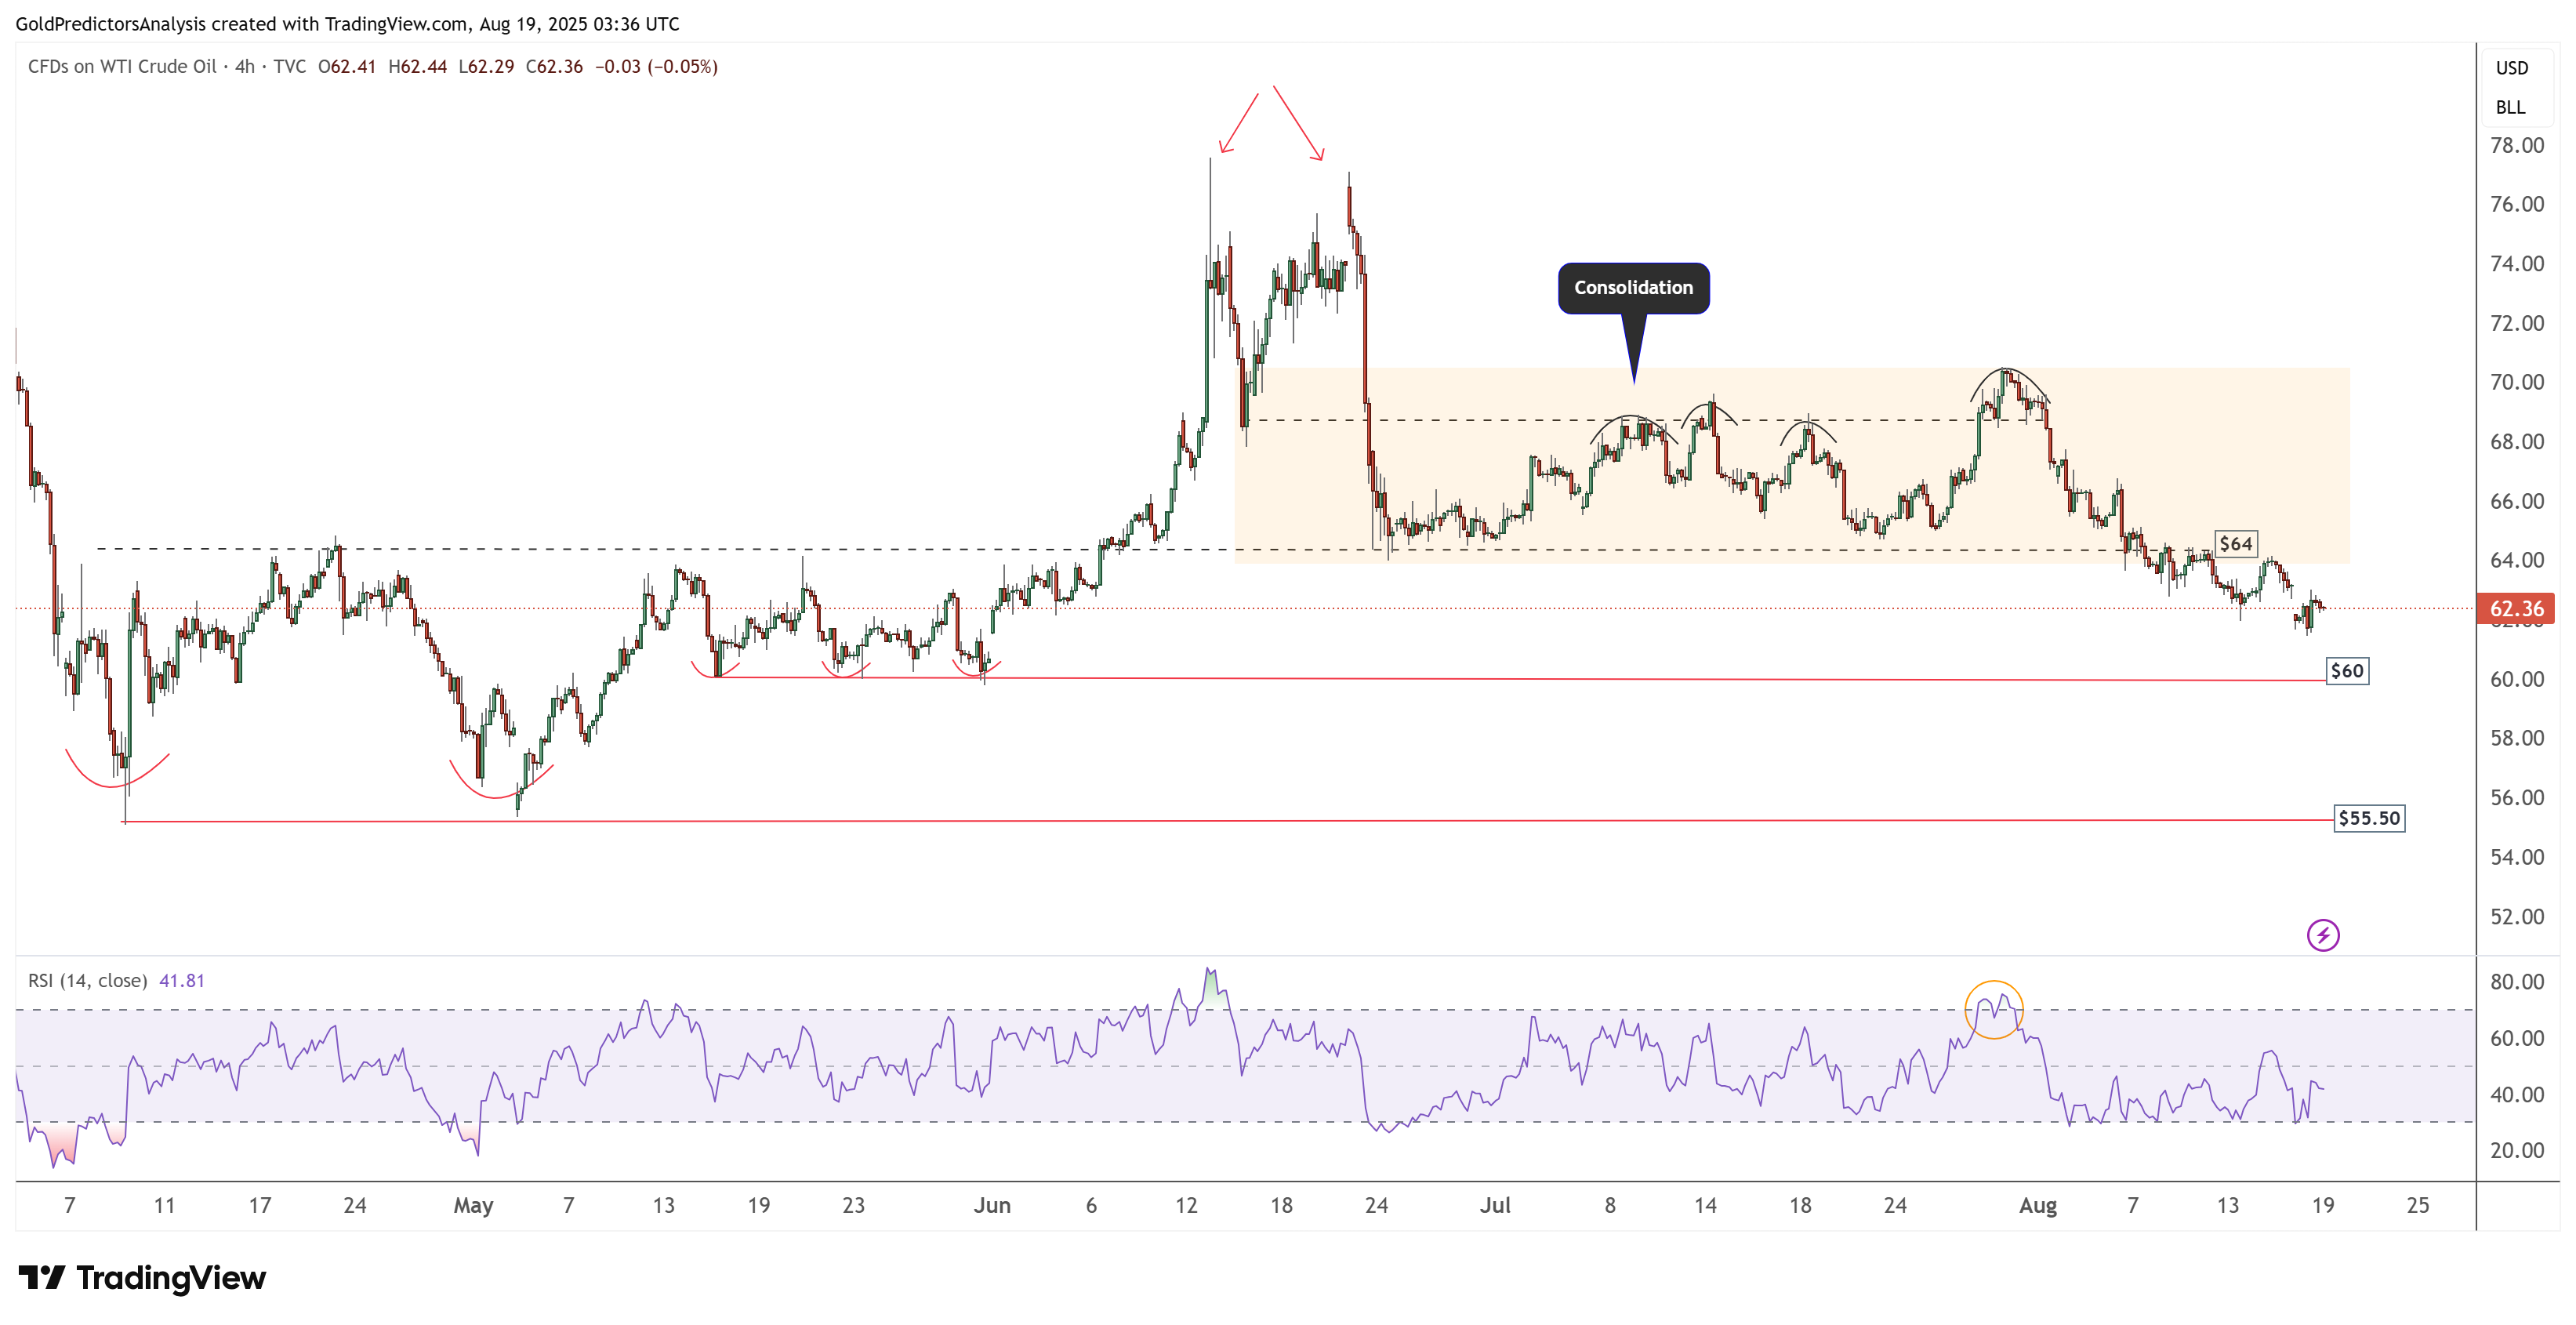
WTI Oil 4-Hour Chart – Consolidation with Bearish Bias
The bearish price action is also visible on the 4-hour chart, where WTI crude has broken below the $64 area and is approaching the $60 support level. A break below $60 would likely push prices toward the $55.50 level. The 4-hour chart also confirms that a recovery above $70 is needed to ease the bearish pressure in WTI crude.