


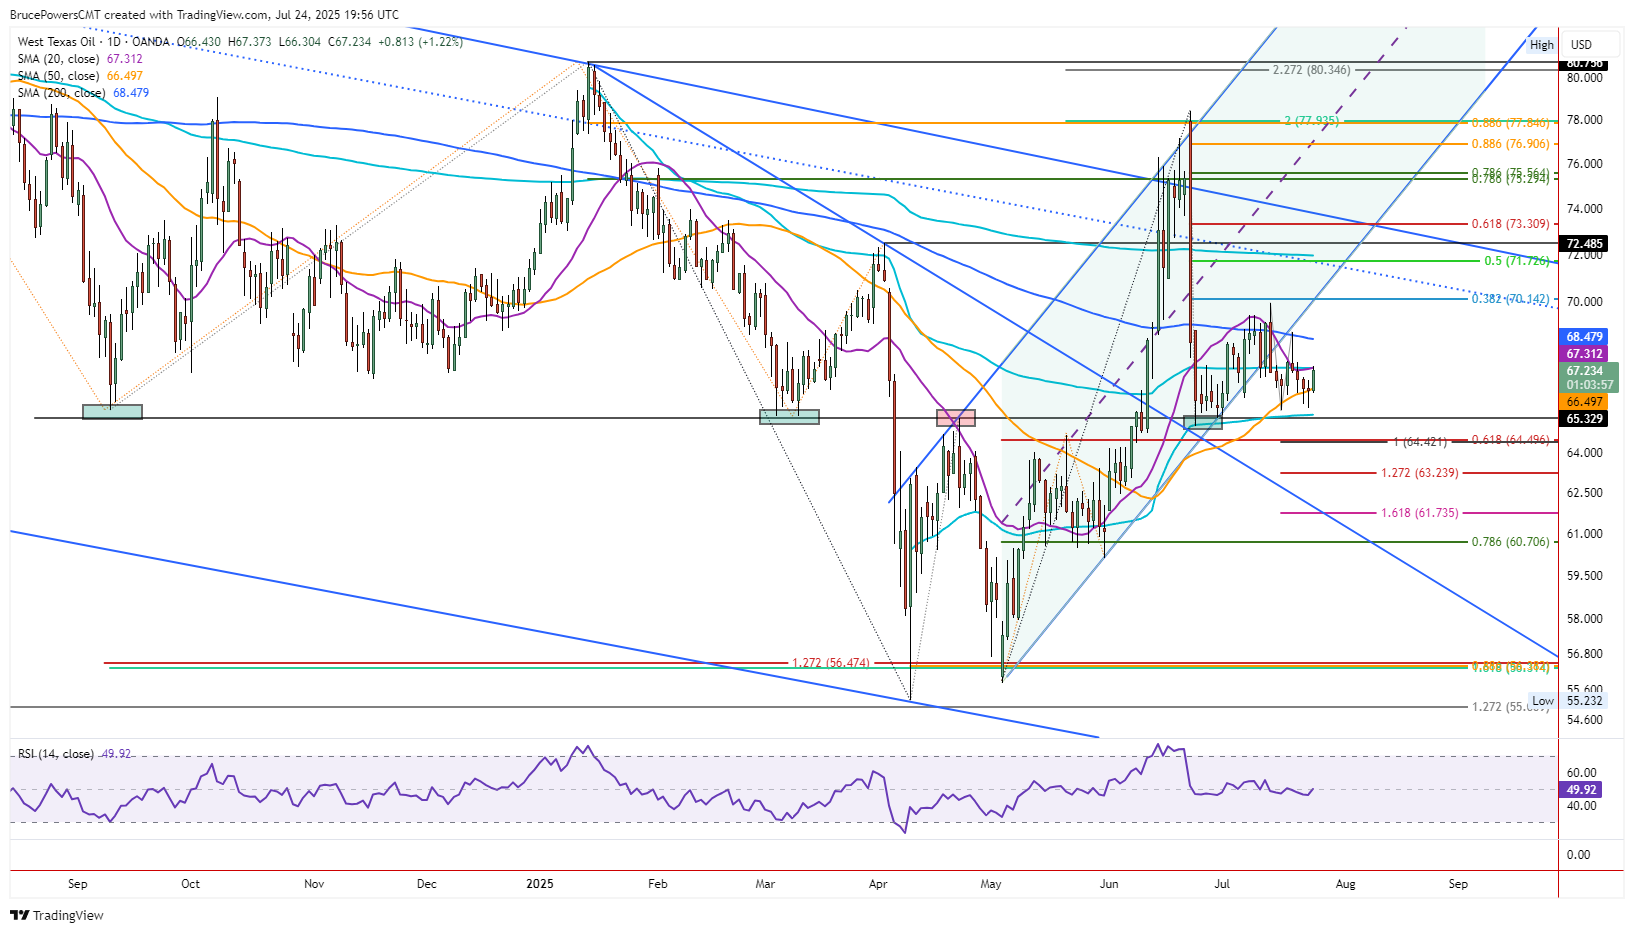
 Crude oil triggered a two-day bullish reversal of a hammer candlestick pattern on Thursday, as it reached a three-day high of $67.37. A higher daily low was also established at $66.30, which was at the 50-Day MA.
The 50-Day line has been tested as support for the past seven days and it has held up. Although there were a few intraday declines below that line, there was not a daily close below it.
Reversal From 50-Day Moving Average
The 50-Day MA is a key trend indicator for dynamic support for crude oil. It was reclaimed in early June and recent lows were the first test of the line as support since it was reclaimed. Today’s bullish reversal indicates that the test of support near the 50-Day may be complete. That opens the door to the possibility of further strengthening in the price of crude oil.
Strong Support Zone Indicated
Furthermore, support around the 50-Day MA is also marked by the neckline of a recent double bottom reversal pattern at $65.32. That price level was confirmed as support following the sharp drop from the June 23 spike high. In addition, notice that the swing lows from September 2024 and March found support in the same price area.
There is also an anchored volume weighted average price (AVWAP) line begun from the April low near the neckline. The AVWAP line also marked support following the sharp drop from the recent high. That is three lines pointing to the same price zone for potential support.


