 WTI crude oil consolidates around the long-term support zone at $66, while natural gas remains in a bullish trend.
Oil prices rebounded on Thursday following stronger-than-expected economic data from major oil consumers. Brent oil (BCO) and WTI crude oil (CL) prices increased as traders responded to signs of improving global demand. Moreover, the easing trade tensions also helped boost market sentiment and reverse the previous session’s losses.
US crude inventories dropped sharply by 3.9 million barrels, signaling increased refinery activity and a tightening of the supply. This larger-than-expected drawdown reflected growing domestic demand. However, gains were limited by rising gasoline and diesel stockpiles, which suggest potential headwinds in refined product demand.
On the other hand, China’s economic data also supported oil prices. Crude throughput in June jumped 8.5% year-over-year, pointing to stronger consumption. Moreover, the positive developments on US-China trade, along with progress on deals with India and Europe, lifted market confidence. These combined factors hint at continued upside for oil in the near term.
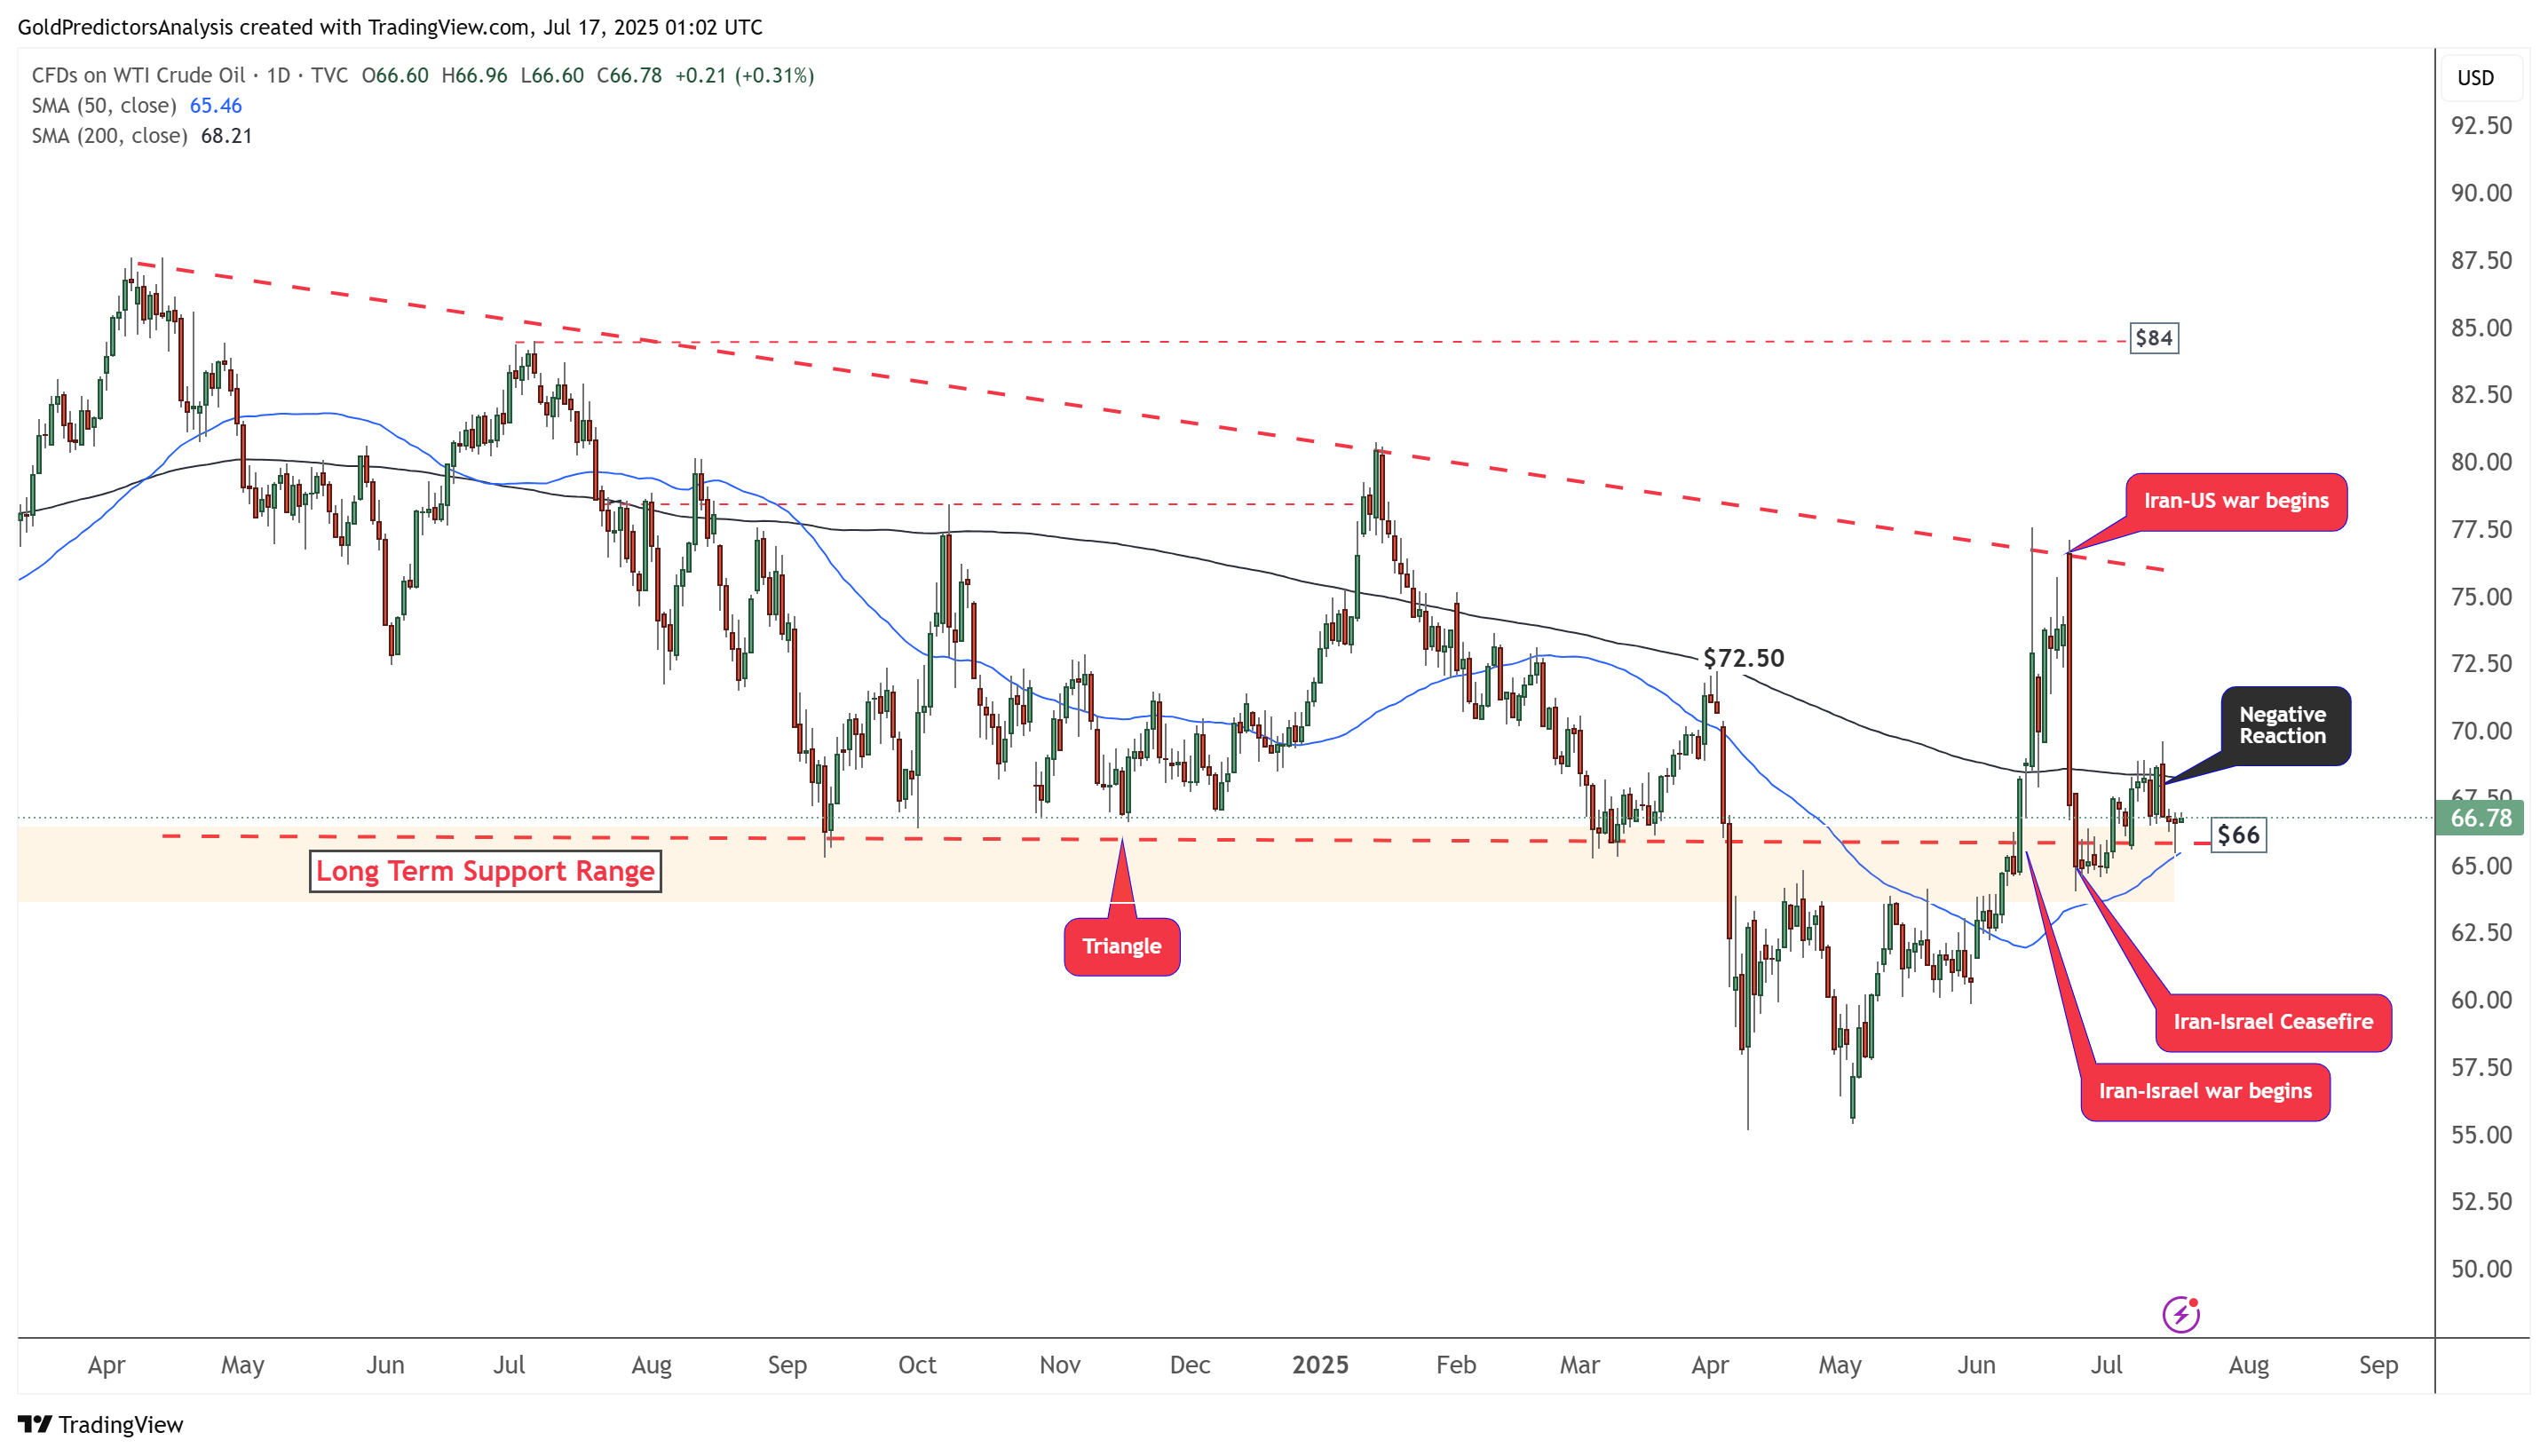
WTI Oil Daily Chart – High Volatility
The daily chart for WTI crude oil shows bearish price action below the 200-day SMA. The geopolitical crisis in the Middle East has triggered heightened volatility in crude oil prices. Despite the fluctuations, the price remains below the 200-day SMA, indicating a continued bearish trend. Therefore, the rebound in the oil prices due to improved economic sentiment might be limited.
A break below the $66 level, followed by a close below $64, would signal further downside potential. Ongoing geopolitical uncertainty keeps oil prices directionless. A decisive break above the $77 level is needed to shift the trend to the upside.
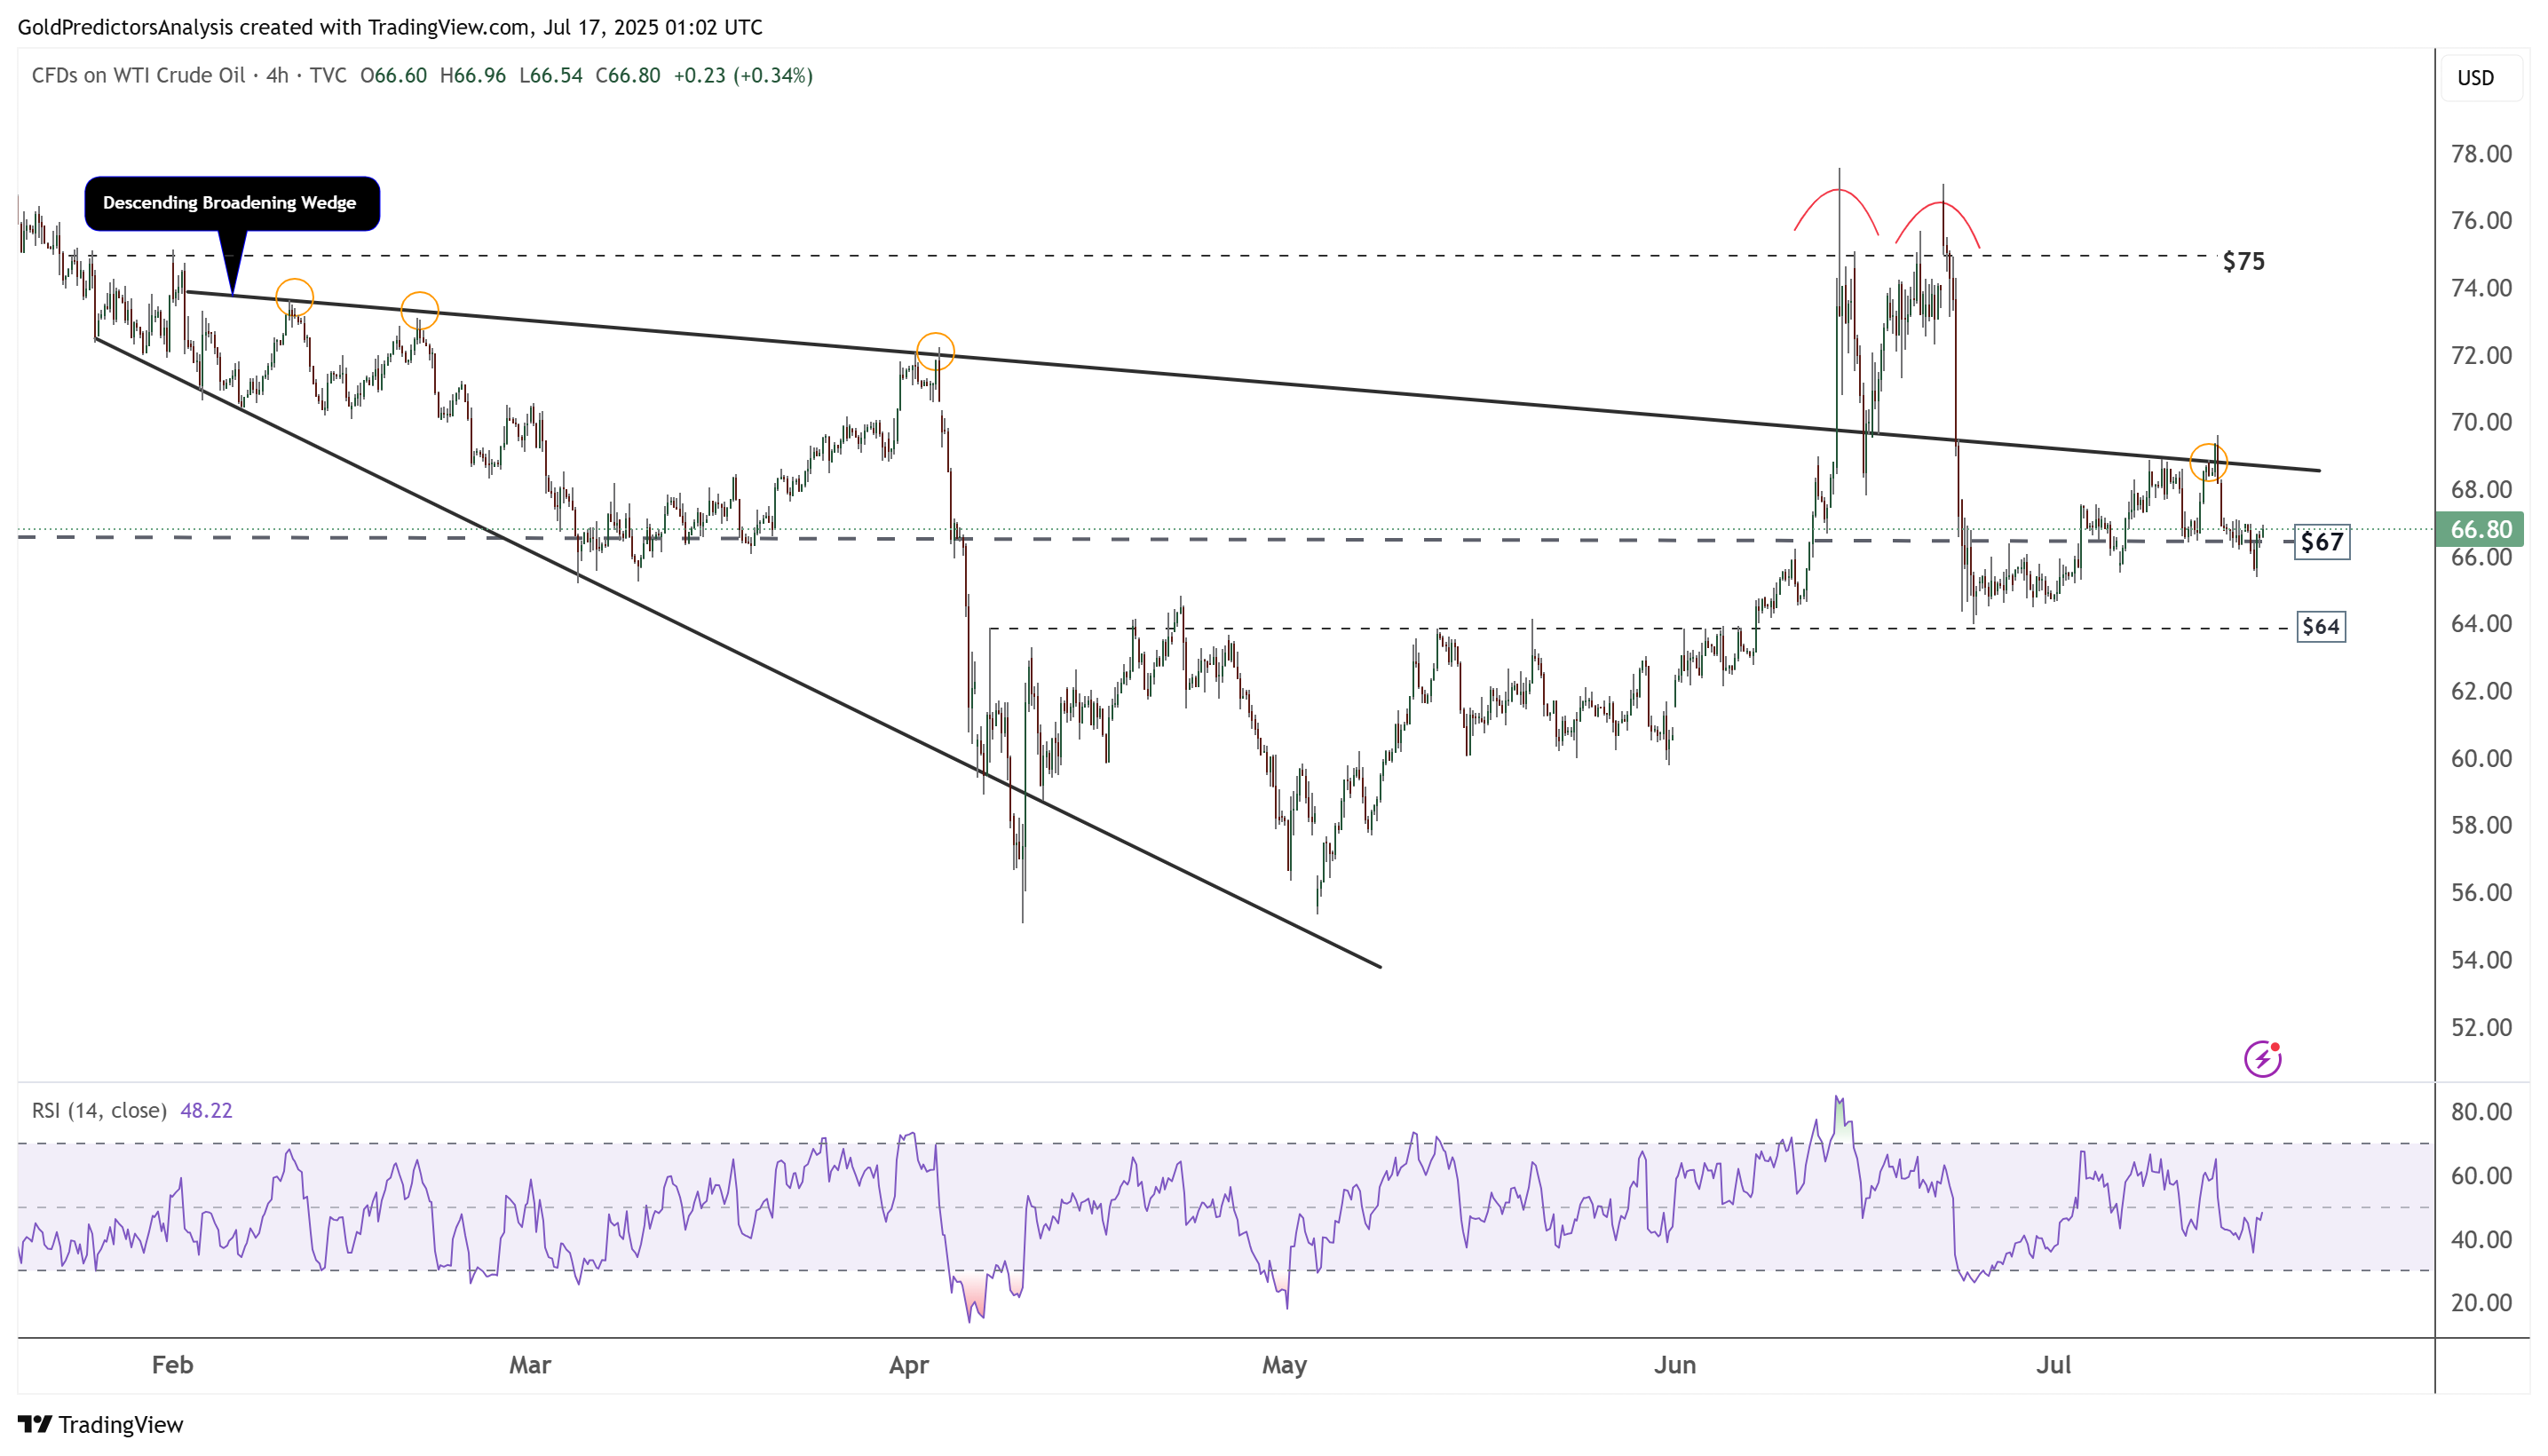
WTI Oil 4-Hour Chart – Double Top Amid Economic Signals
The 4-hour chart for WTI crude oil shows that the price is trading within a descending broadening wedge pattern. A breakout above the wedge, followed by a double top near the $77 area, failed to hold. As a result, the price has remained within the pattern and is consolidating around the $64 and $66 levels. A break below $64 would signal further downside in WTI crude oil prices.