 Donald Trump’s 50-day deadline for Russia to end the Ukraine war has created short-term volatility in oil markets. Prices initially spiked on fears of direct sanctions on Russian oil buyers. However, the possibility of a negotiated peace within the deadline has eased immediate supply concerns. Traders now believe sanctions may be avoided, reducing upward pressure on oil prices.
Brent crude oil (BCO) dropped to $69, while WTI crude oil (CL) dropped to $66.80. This decline reflects uncertainty over whether the US will follow through with harsh sanctions. The broader concern is Trump’s trade policies, which add another layer of risk to global demand.
Trump’s plan to impose 30% tariffs on imports from the EU and Mexico starting 1 August raises fears of a global slowdown. These tariffs may hit economic growth and lower fuel consumption. Slower trade and weaker industrial activity typically reduce oil demand, creating downward pressure on prices.
Despite these concerns, oil demand remains firm in the short term. OPEC expects strong demand through Q3, supporting prices near current levels. Additionally, Goldman Sachs raised its oil outlook for H2 2025, citing tight inventories and supply constraints. This suggests that while geopolitical and trade tensions may cause short-term swings, structural supply factors could still support prices.
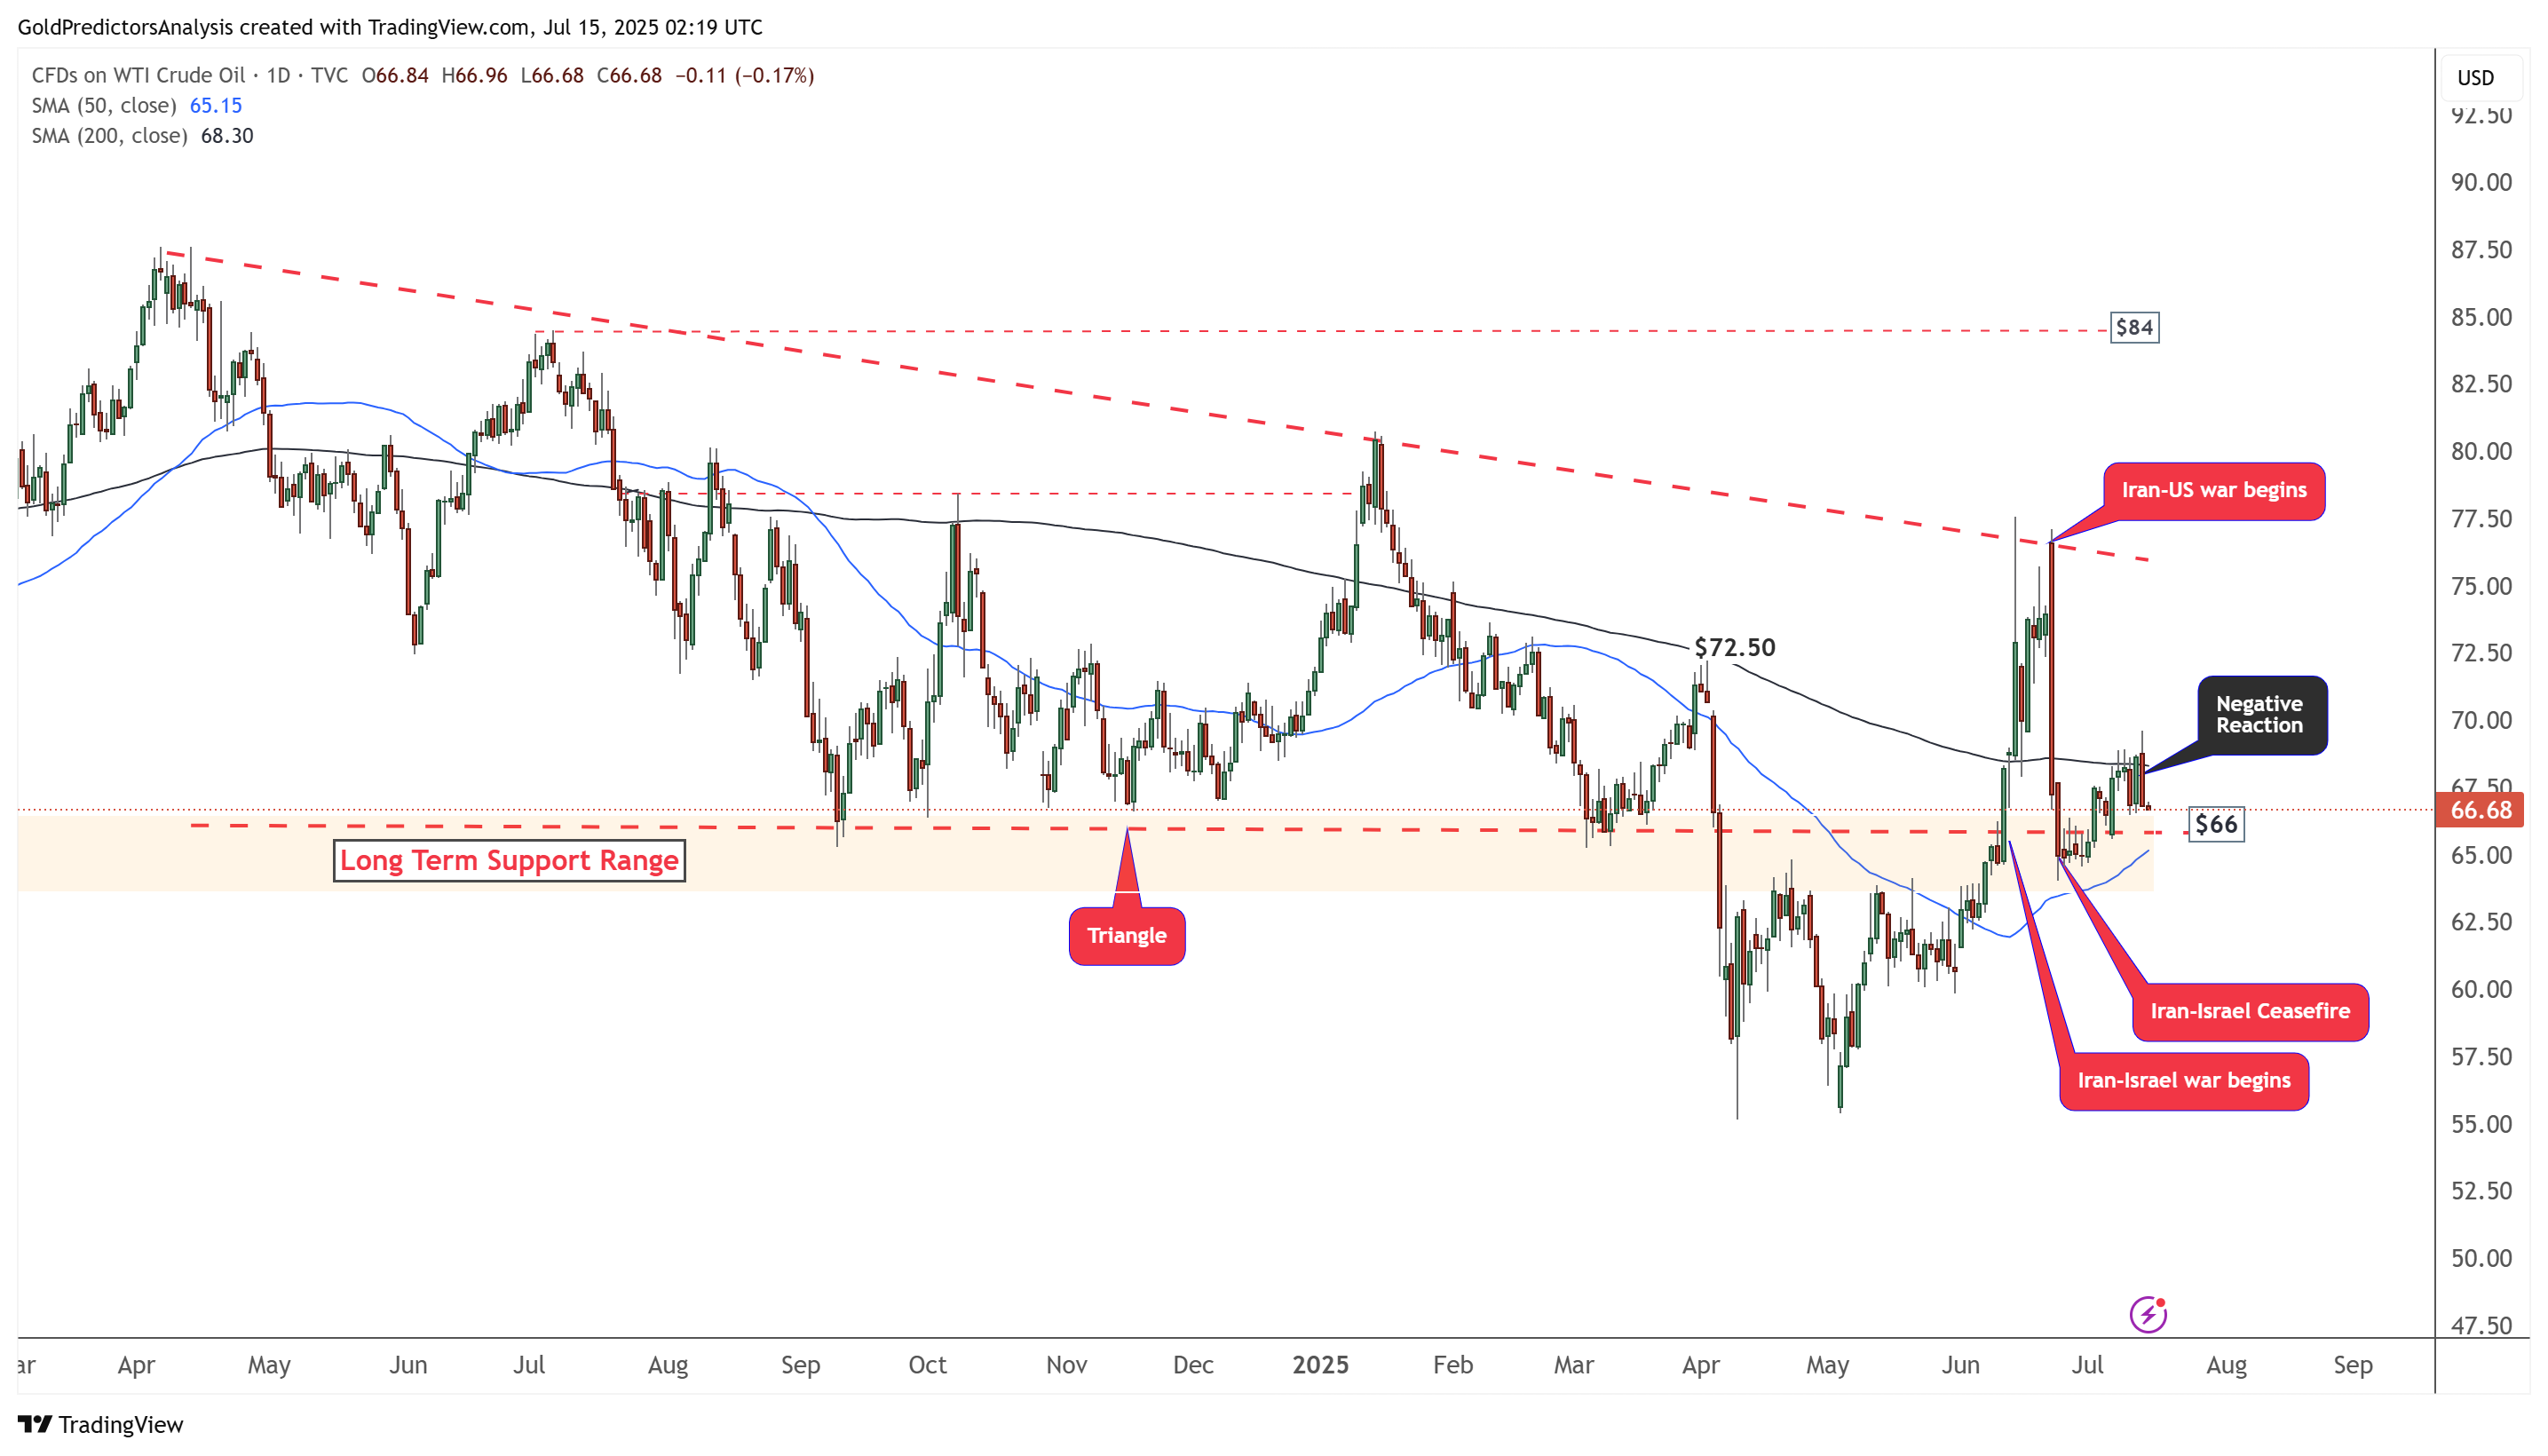
WTI Oil Daily Chart – High Volatility Amid Russia Sanctions
The daily chart for WTI crude oil shows that the price failed to break above the 200-day SMA and continued lower. The price peaked at the red dotted trendline near $77, then dropped sharply toward the long-term support at $66. This move indicates a negative trend.
The ongoing uncertainty from the Iran-U.S. and Iran-Israel conflicts has added downside pressure to the oil market. Moreover, threats of Russian sanctions further fuel volatility. However, volatility remains high due to geopolitical risks. A break above the $77 level is needed to trigger a further rally toward higher prices.
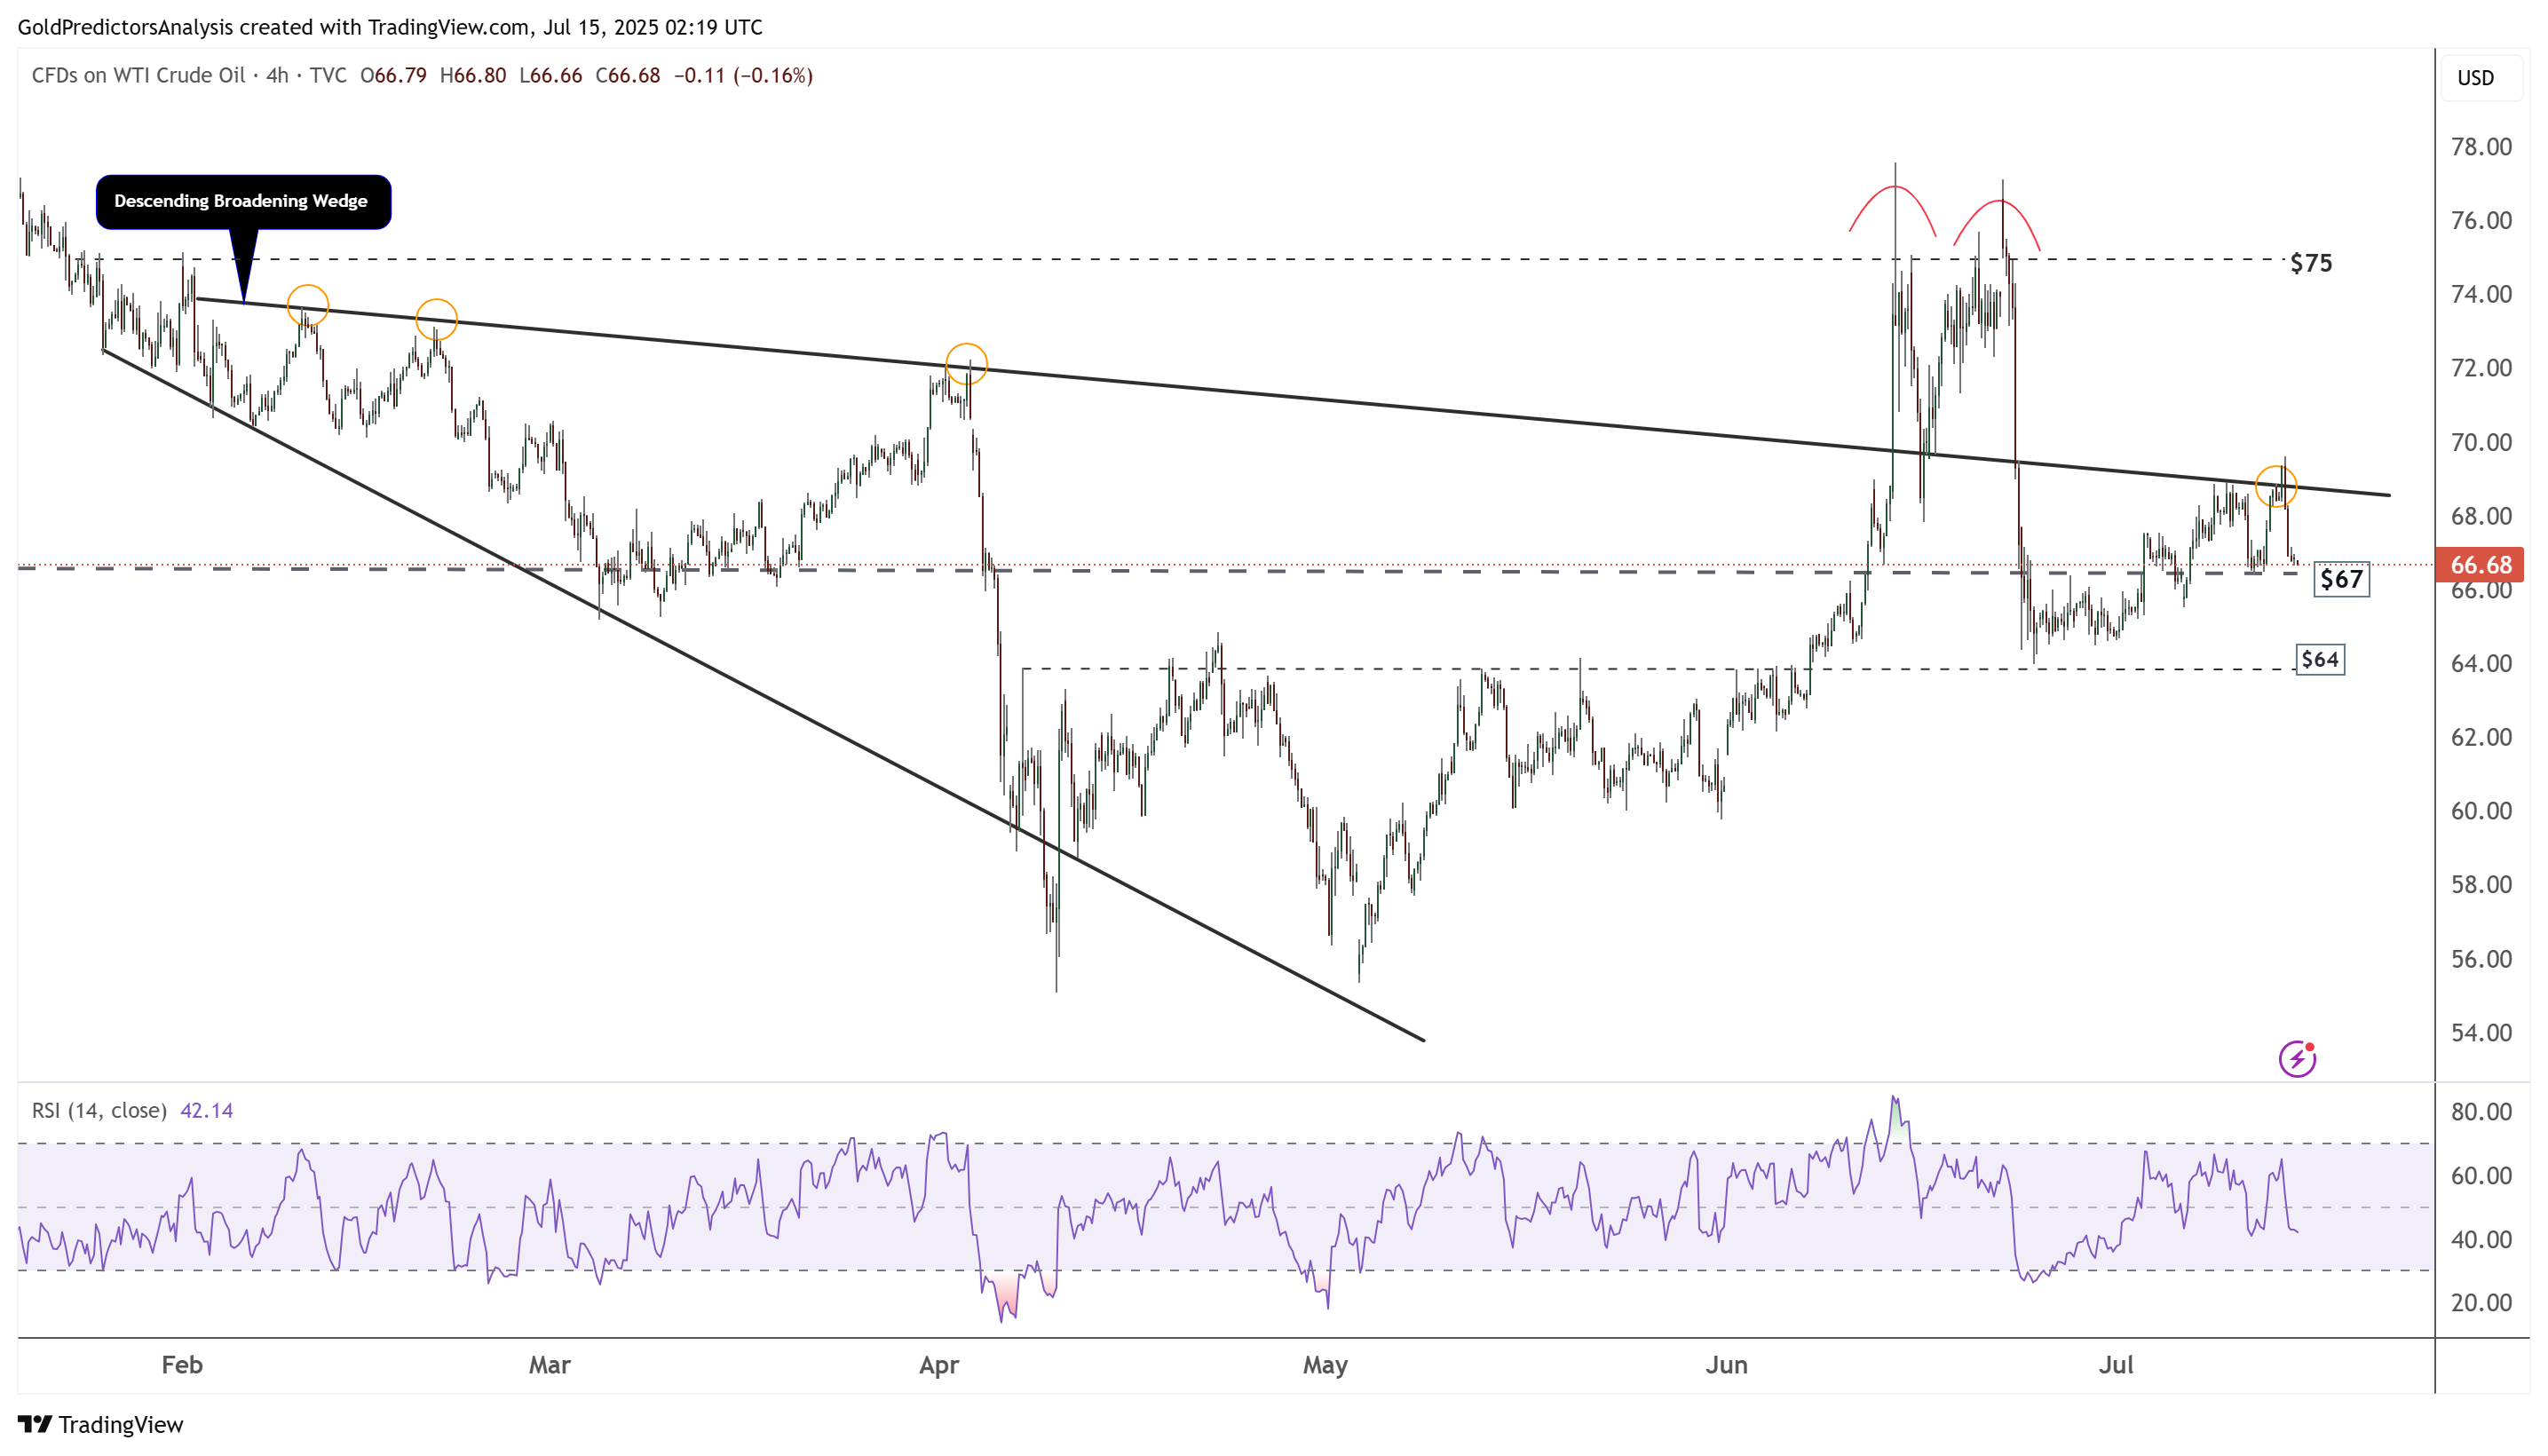
WTI Oil 4-Hour Chart – Double Top and EU Tariffs
Strong volatility is also observed on the 4-hour chart of WTI crude oil, which shows that a double top has formed near the $77 area. Since then, the price has been trading within a descending broadening wedge pattern, indicating further downside in oil prices.
Uncertainty in the oil market due to the tariff tensions has increased fears of an oil shortage, which may induce strong volatility and make the price direction uncertain. A break below $64 will likely initiate further downside in oil prices.