 Oil prices rebounded on Monday despite OPEC+ announcing a larger-than-expected increase in production. WTI oil (CL) recovered from early losses and traded above $67 during the Asian session. The oil cartel agreed to raise output by 548,000 barrels per day, exceeding market expectations of 411,000 barrels per day. While this supply increase may put downward pressure on prices, ongoing trade tensions are adding strong volatility to the energy sector.
Treasury Secretary Scott Bessent indicated that several trade deals may be finalized soon. This optimism supports oil demand expectations and offsets some bearish sentiment from the OPEC+ supply boost. However, delays in finalizing these deals could quickly reverse the current price recovery.
Another factor is President Trump’s decision to send tariff letters to countries that failed to close deals during the 90-day pause. If more tariffs are imposed, global trade could weaken, hurting oil demand. The oil market remains sensitive to these developments, with geopolitical and trade uncertainties continuing to drive short-term volatility.
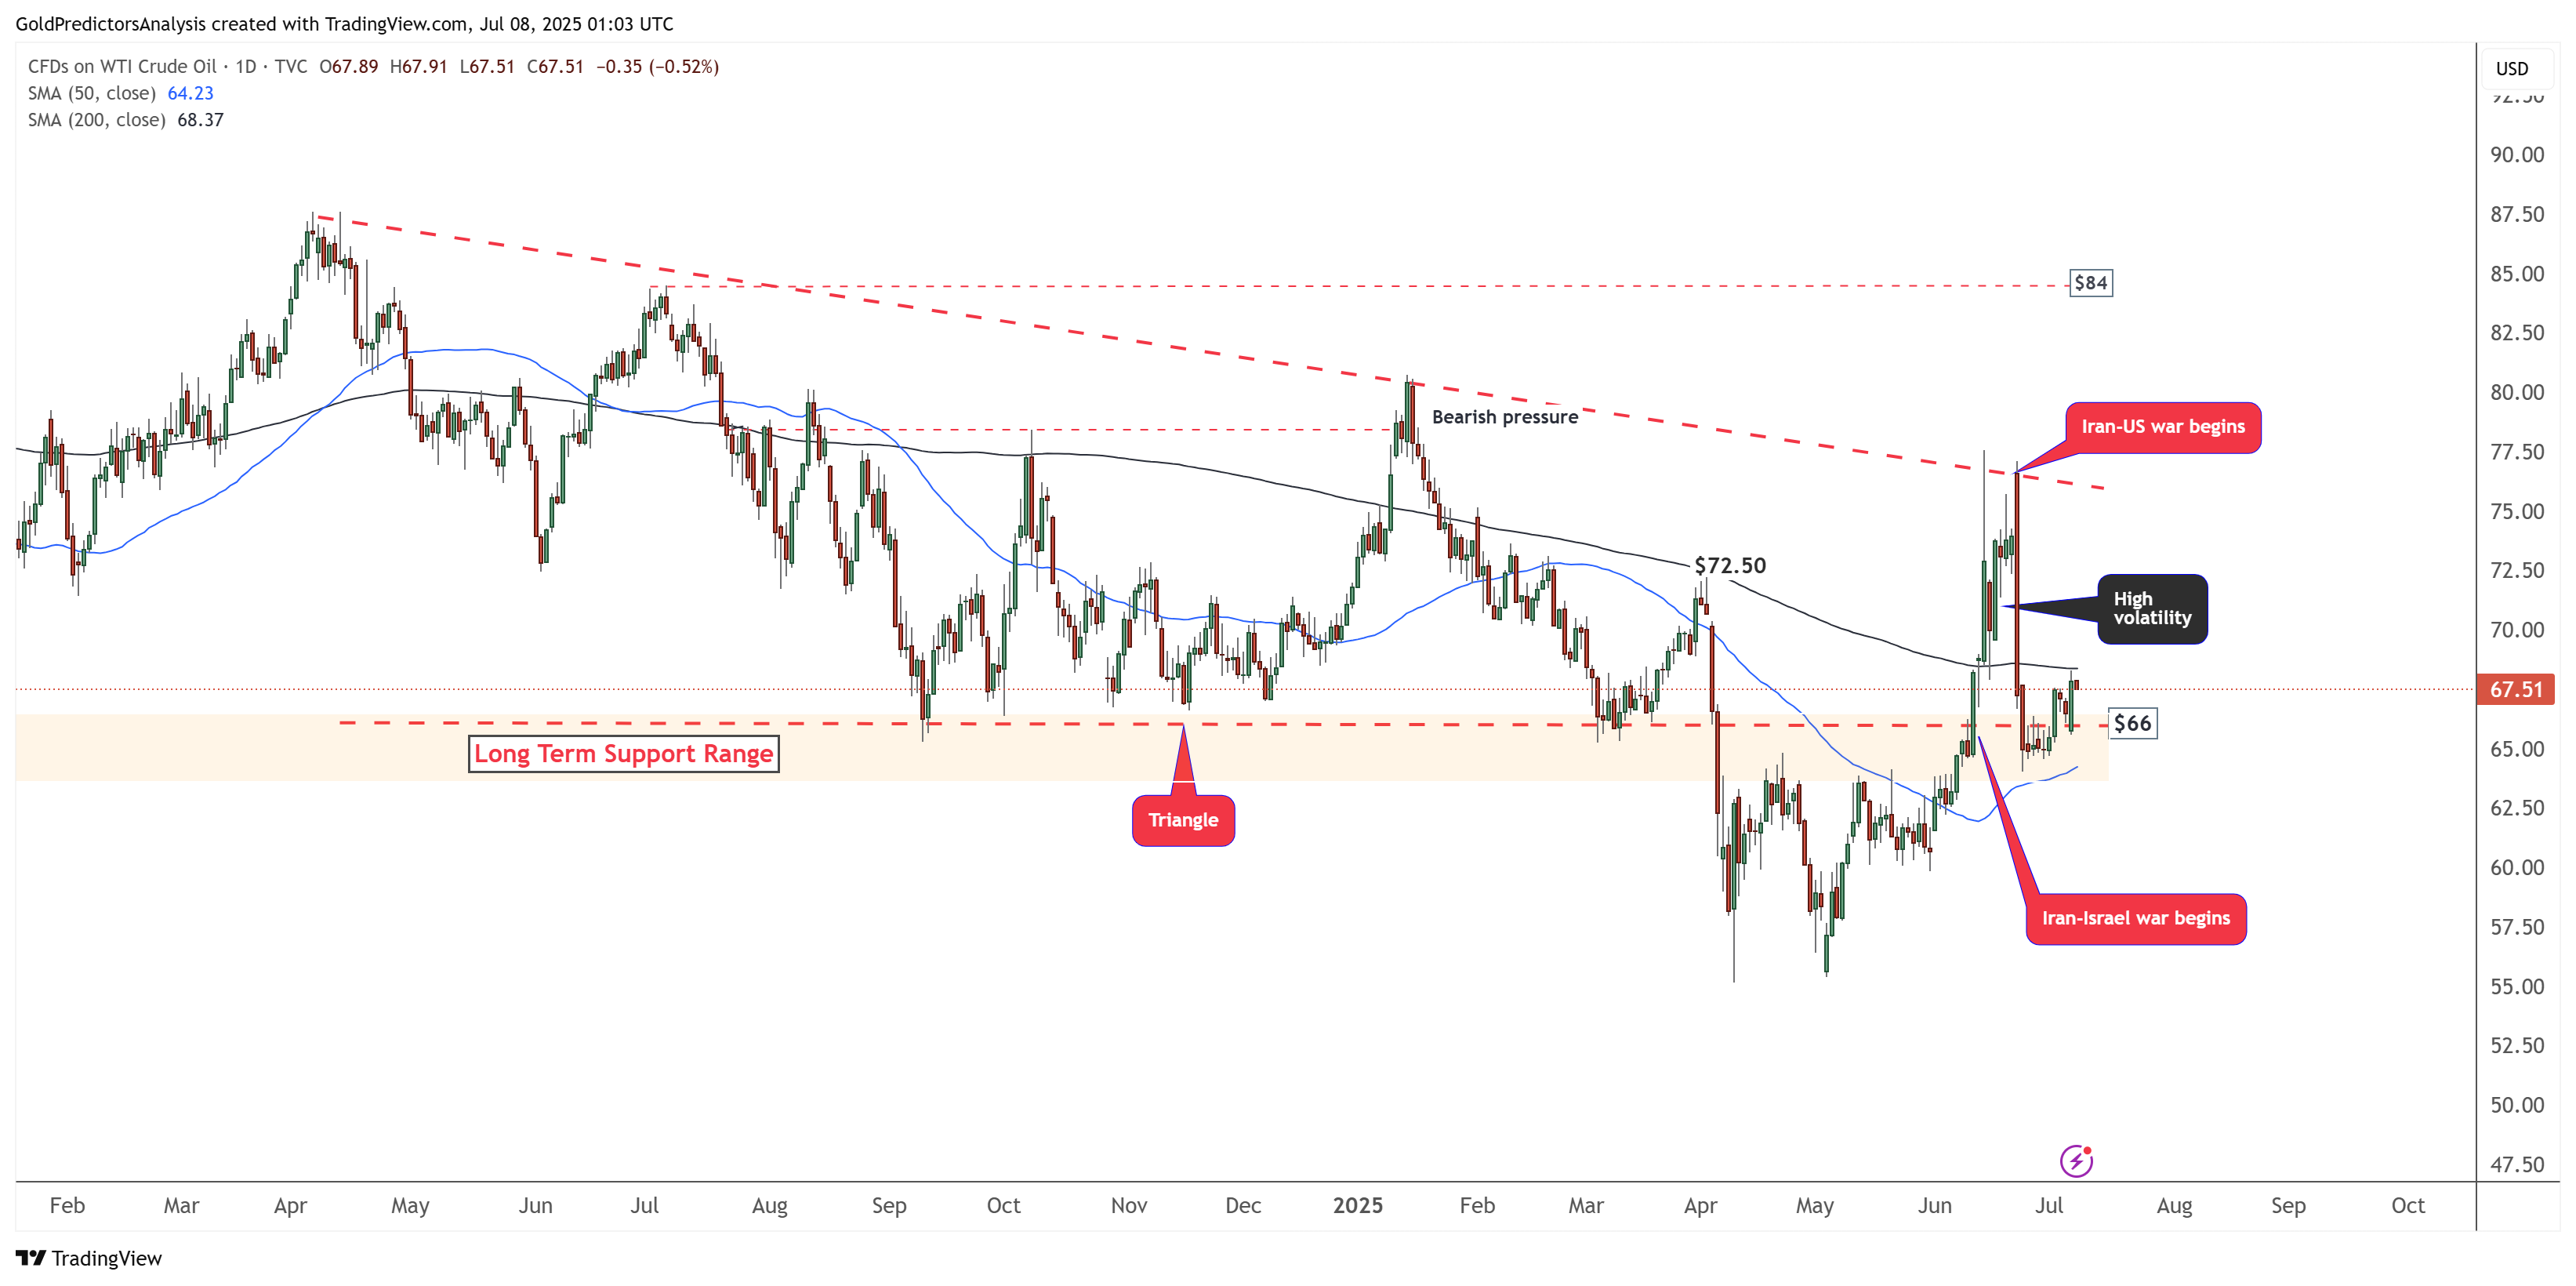
WTI Oil Daily Chart – Consolidation
The daily chart for WTI crude oil shows that the price is consolidating above the $66 support level. This consolidation is occurring between the 50-day and 200-day SMA. The orange zone highlighted in the chart indicates the long-term support range, from which the price is currently rebounding. Geopolitical tensions in the Middle East, including the Iran-Israel conflict and rising friction between Iran and the US, have created significant volatility in the WTI crude market.
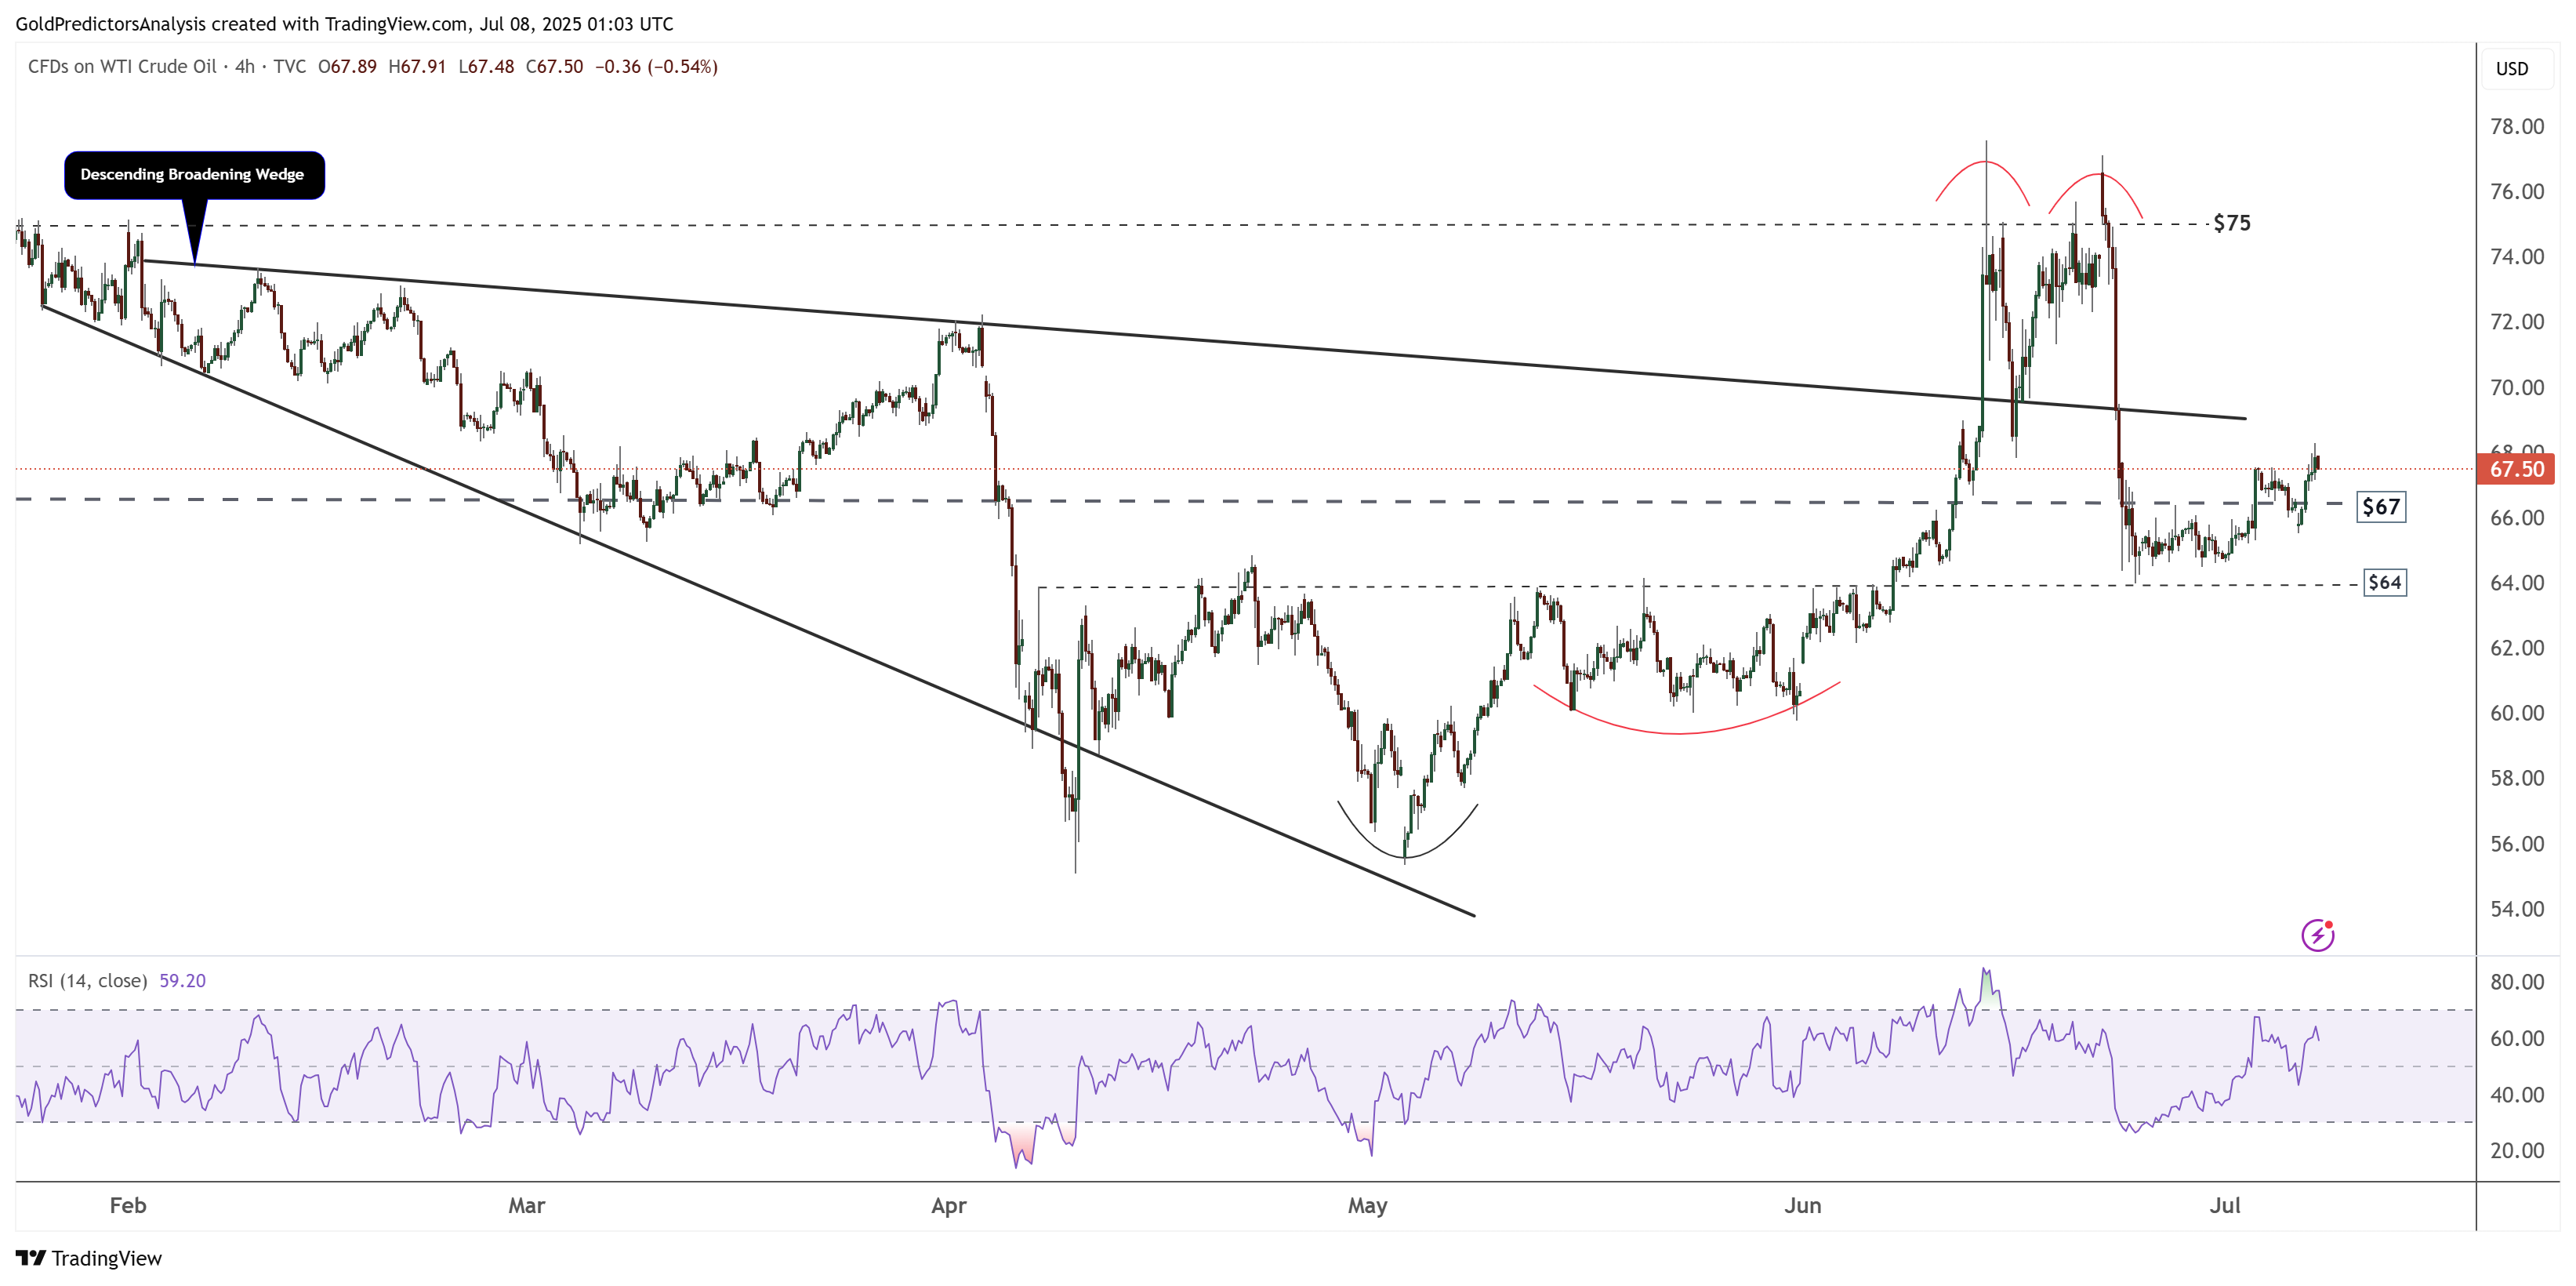
WTI Oil 4-Hour Chart – Double Top
The 4-hour chart shows that WTI crude oil is experiencing high volatility and has formed a double top pattern near the $77 area. The rebound from the $64 support level is pushing the price back toward the resistance of the descending broadening wedge pattern. As long as the price remains below the $69 area, the likelihood of further downside remains high.