 WTI crude oil rebounds from the long-term support at $66, while natural gas remains in a bullish trend above the $3 support level.
Oil prices rose on Wednesday, driven by geopolitical tensions and developments in trade. Iran suspended cooperation with the UN nuclear watchdog, sparking fears of renewed instability in the Middle East. This move added a geopolitical risk premium to oil markets, despite no physical supply disruptions occurring. At the same time, a US-Vietnam trade deal boosted market sentiment and added to the rally.
Brent crude oil (BCO) settled above $69 per barrel, while WTI crude oil (CL) increased to $67.45. However, gains were capped after the US reported a surprise build in crude inventories. The chart below shows that the domestic stockpiles rose by 3.8 million barrels, defying expectations of a drawdown. The weak gasoline demand below 9 million barrels per day raised concerns about consumption during the peak summer driving season.
Traders also took into account upcoming OPEC+ supply increases. The group is expected to raise output by 411,000 bpd in August. Saudi Arabia already increased shipments by 450,000 bpd in June. However, total OPEC+ exports remain steady, suggesting that rising domestic demand in the Middle East may absorb much of the added supply.
Market focus will now shift to the upcoming US jobs report. The strong employment data could delay interest rate cuts, while weaker data may accelerate monetary easing. Moreover, the lower rates would likely support economic activity and boost oil demand. However, geopolitical risks and inventory data will continue to drive short-term price movements.
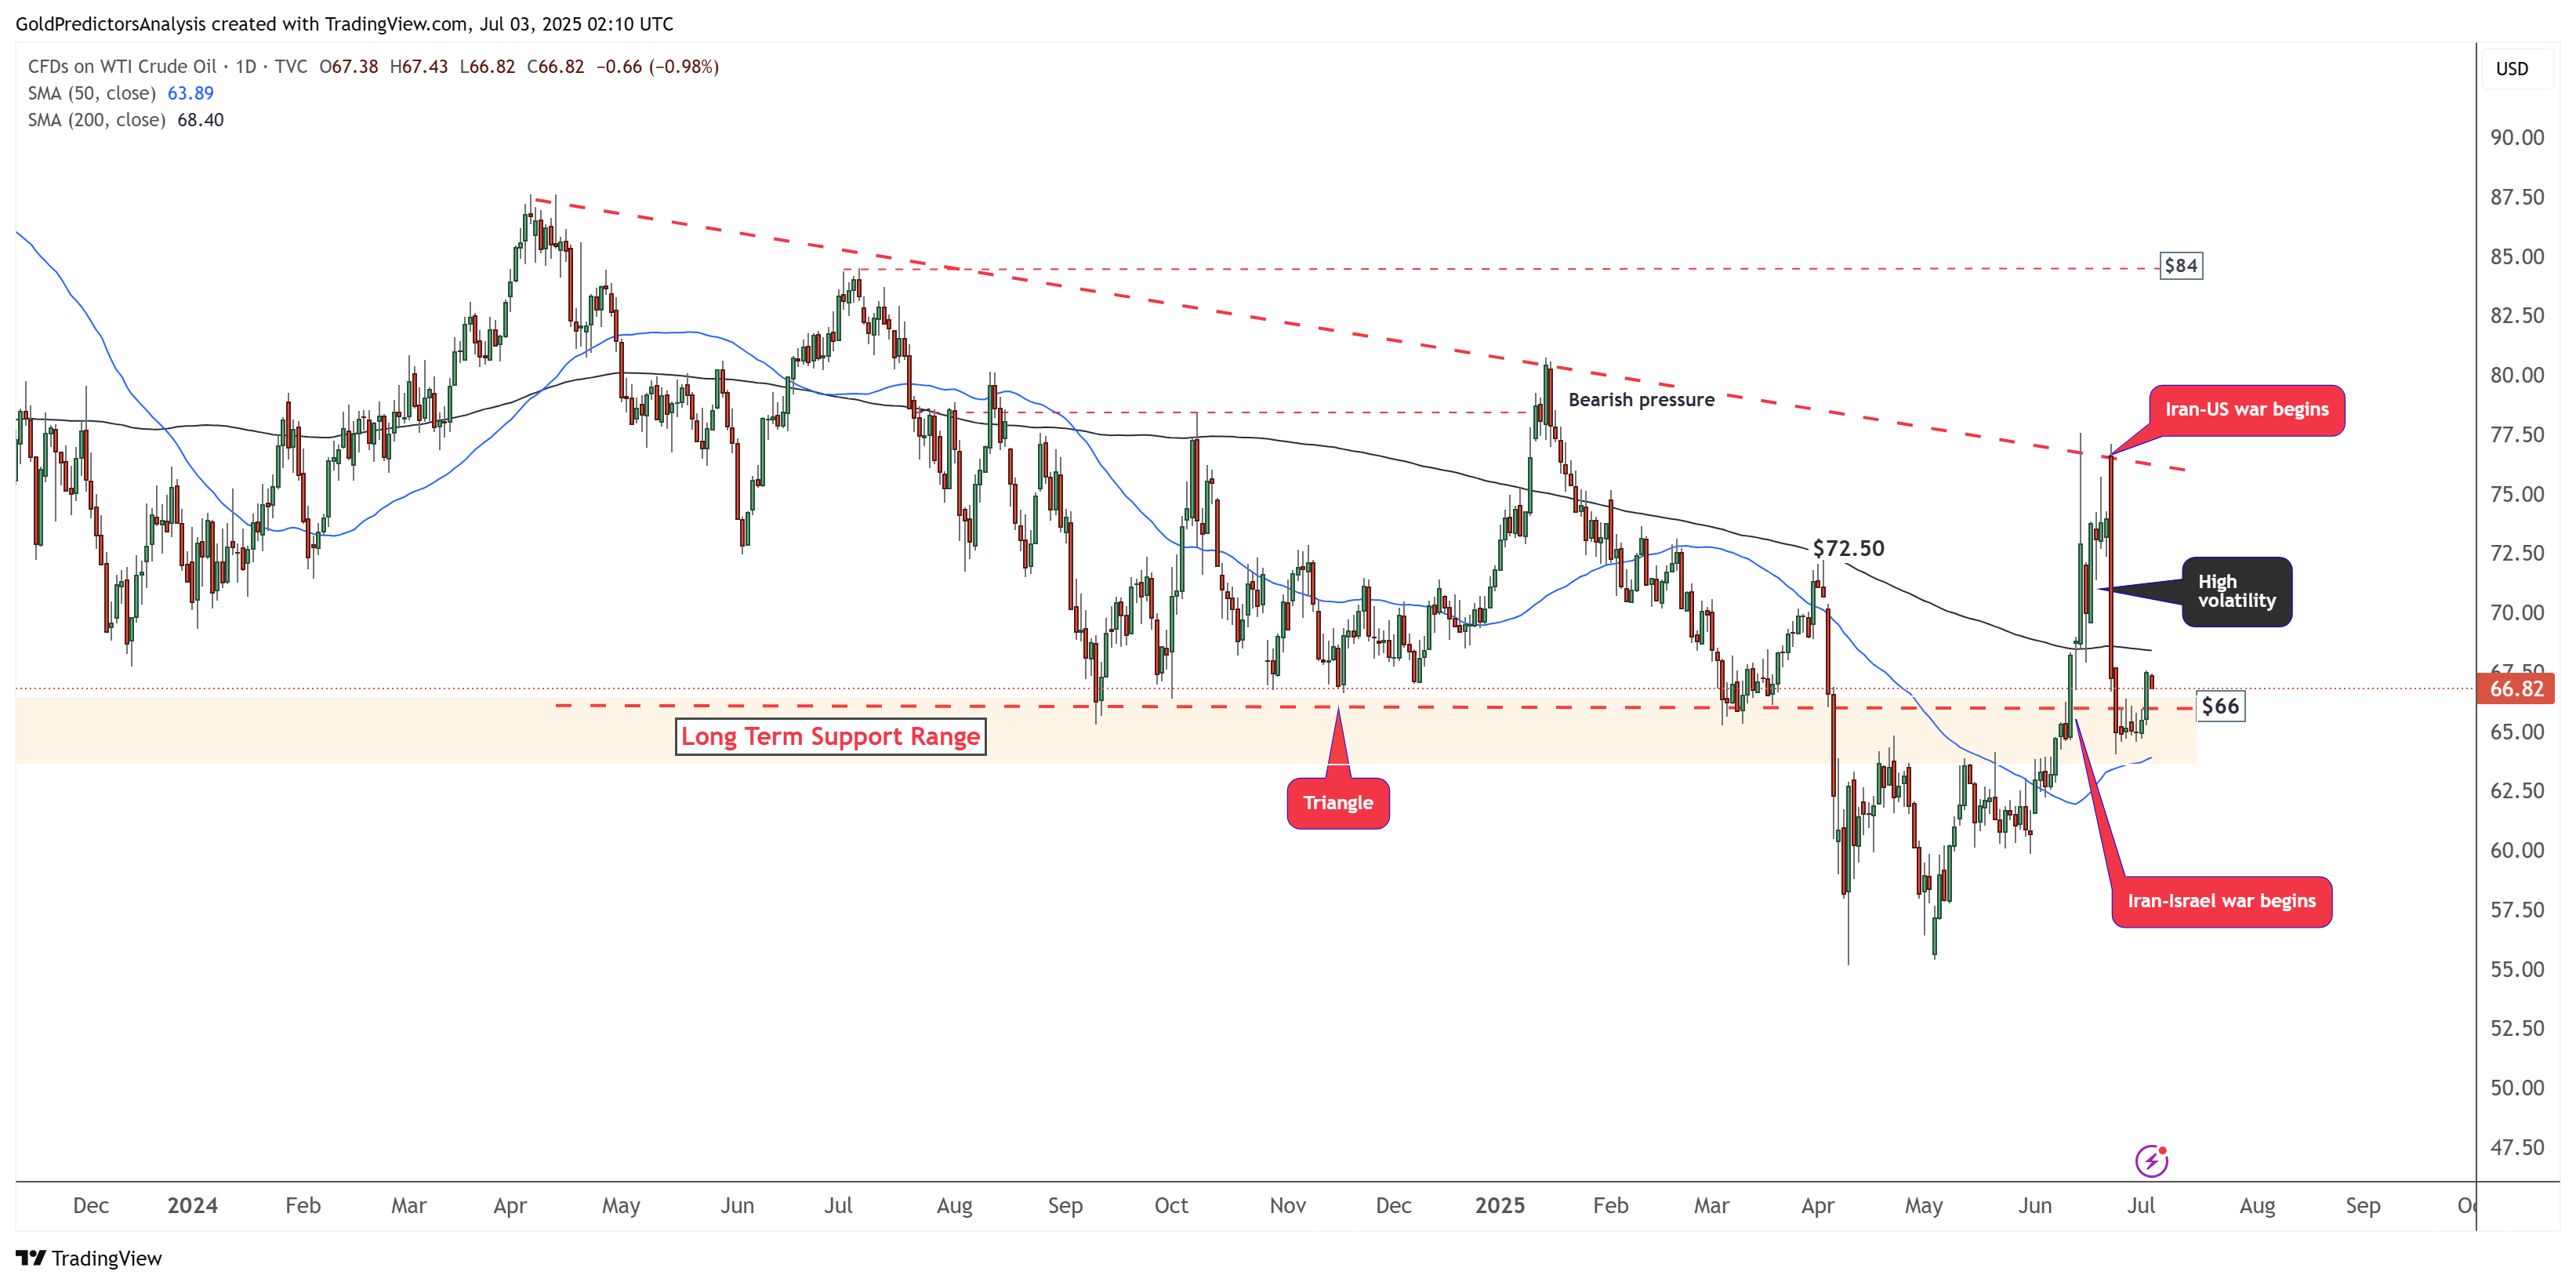
WTI Oil Daily Chart – Strong Volatility
The daily chart for WTI crude oil shows that the price rebounds from $66, which represents a long-term support range. This support zone is highlighted in orange on the daily chart. The price is currently consolidating between the 50-day and 200-day SMAs, awaiting its next move. The sharp correction from the $77 level, followed by consolidation above $66, reflects growing price uncertainty.
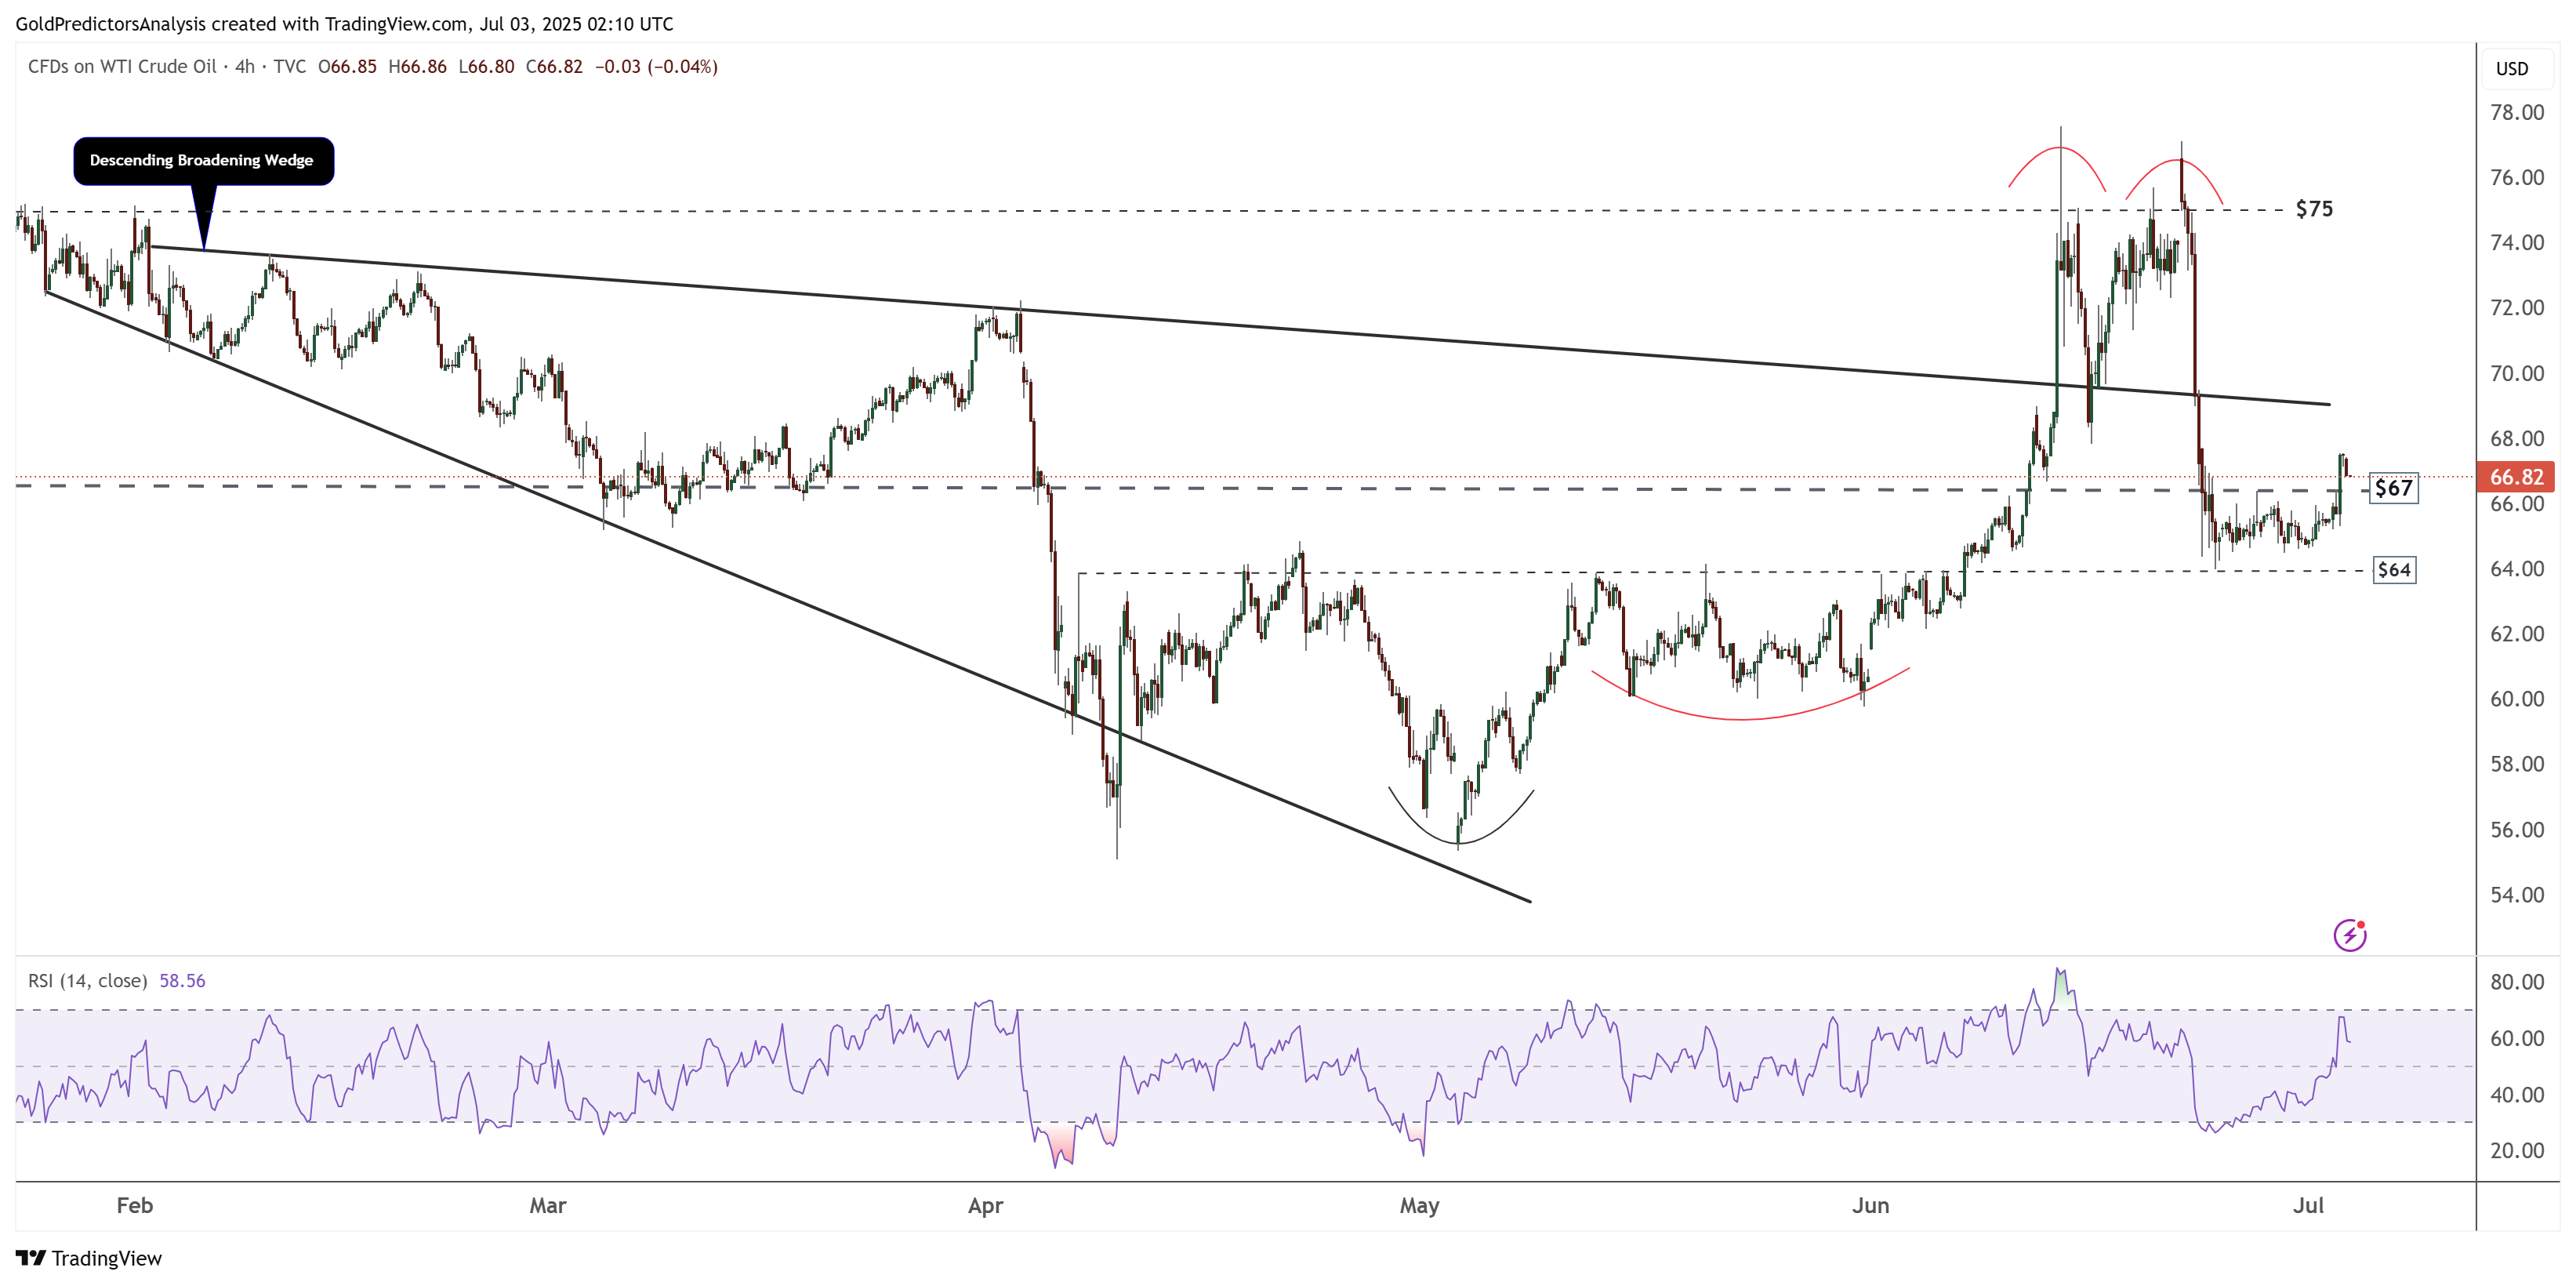
WTI Oil 4-Hour Chart – Double Top
The 4-hour chart for WTI crude oil shows that the price is consolidating within the $64 to $67 range. The formation of a double top near the $77 region indicates negative price action. However, ongoing geopolitical tensions in the Middle East are contributing to increased price uncertainty, which may lead to heightened volatility in oil prices.