


 Crude oil continued its advance to a new trend high of $69.16 on Thursday before encountering resistance and pulling back intraday. Trading continues below the opening price, at the time of this writing, but in the upper half of the day’s trading range, indicating remaining buying pressure. However, the rally has reached a key potential resistance zone, indicating the possibility of a pullback. The low for the day was $66.85 and it marks near-term support for crude oil.
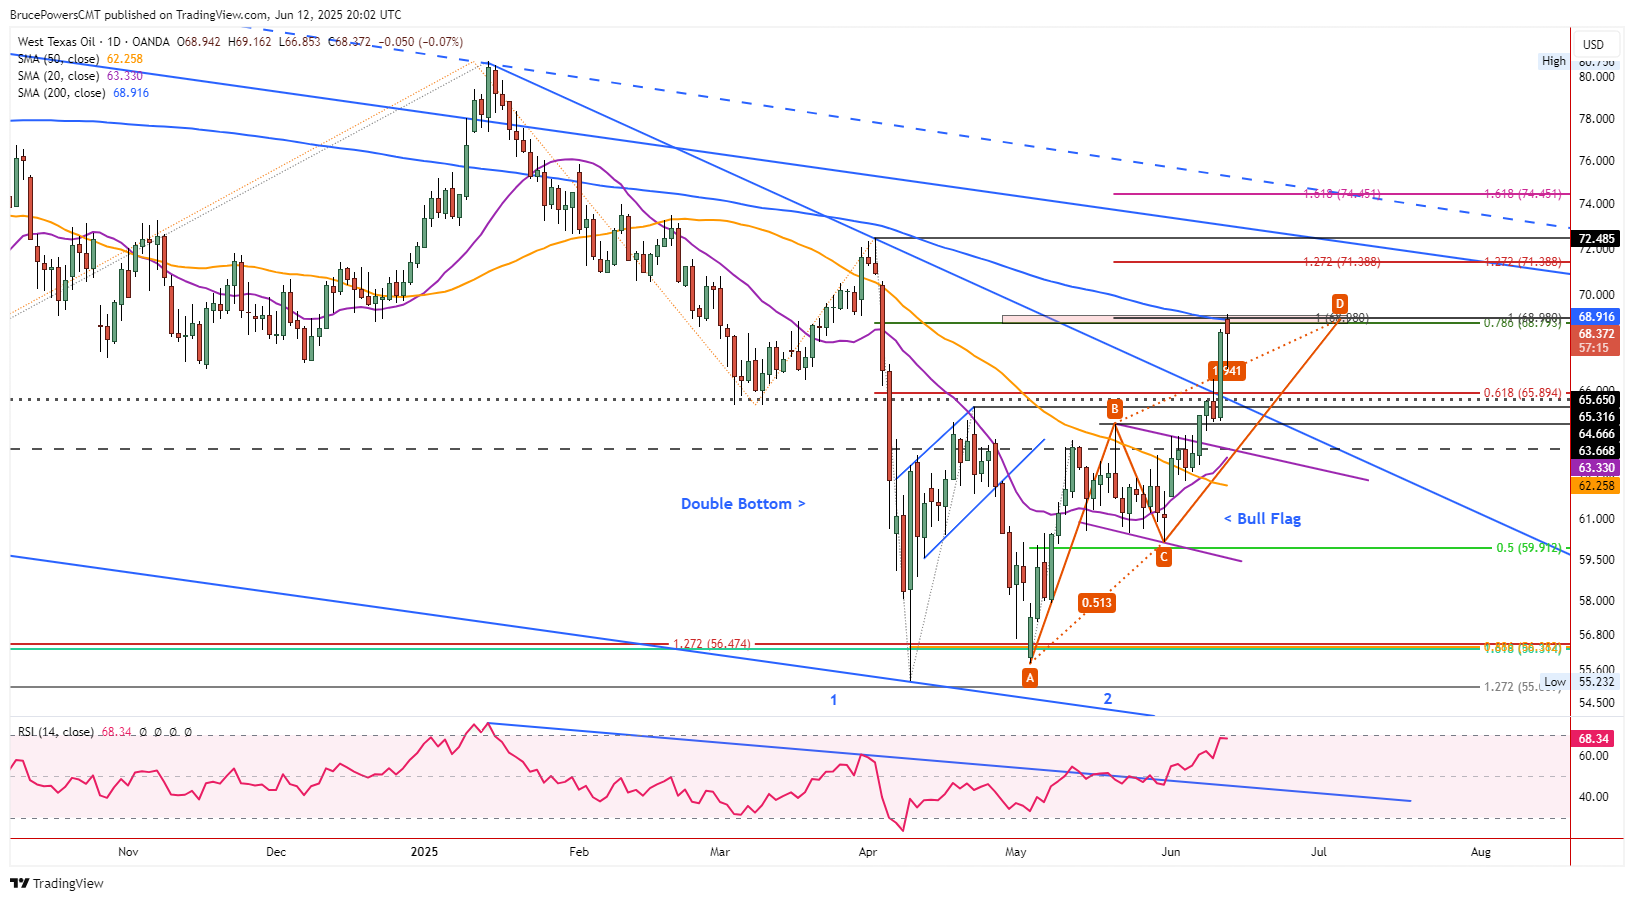
Initial Target Reached
An initial key upside target zone from $68.79 to $68.98 has been defined on the chart for a couple weeks, consisting of a 78.6% Fibonacci retracement level and initial target for a rising ABCD pattern, respectively. The 200-Day MA, now at $68.92, was also a part of the potential target zone. It had represented a higher price point until converging with the ABCD target earlier this week.
Bull Flag and Double Bottom Point Higher
Last Friday, crude oil triggered an upside-breakout of a bull flag pattern, and then on Monday a double bottom bullish reversal pattern triggered. Each breakout was confirmed by a daily close above the breakout level. Subsequently, a trendline break confirmed strength yesterday with a daily close above a downtrend line connecting the early-April swing high. Each pattern shows the potential for higher targets to eventually be reached.
The smaller bull flag pattern measures to a potential upside target of around $72.52, while the larger double bottom points to the potential for $75.40. Although this does indicate the potential for higher prices, eventually, targets are the least reliable component of technical analysis and that needs to be considered.


