 WTI crude oil (CL) increased to $62.10 in early Tuesday trading. This price increment was due to the nuclear talks between the US and Iran, which showed signs of collapse. Iran warned that negotiations would fail if the US demands a complete halt to uranium enrichment. The US insists on zero enrichment, raising geopolitical tensions. These developments limited the possibility of an increased Iranian oil supply, which supported crude oil prices.
However, bearish factors continue to weigh on the oil market. Moody’s downgraded the US credit rating from ‘Aaa’ to ‘Aa1’. The agency cited unsustainable deficits and rising interest costs. This downgrade raised concerns over the health of the US economy. As the world’s largest oil consumer, weaker US growth could reduce oil demand. This adds downside pressure to WTI crude oil despite recent gains.
Moreover, slowing demand in China also threatens oil price stability. The chart below shows retail sales in April rose only 5.1% year-over-year, missing the 5.5% forecast and down from 5.9% in March. As the world’s top oil importer, weak consumer spending signals softer demand for crude. Economic uncertainty in the US and China limits the upside for WTI crude oil and increases the risk of another pullback below $60.
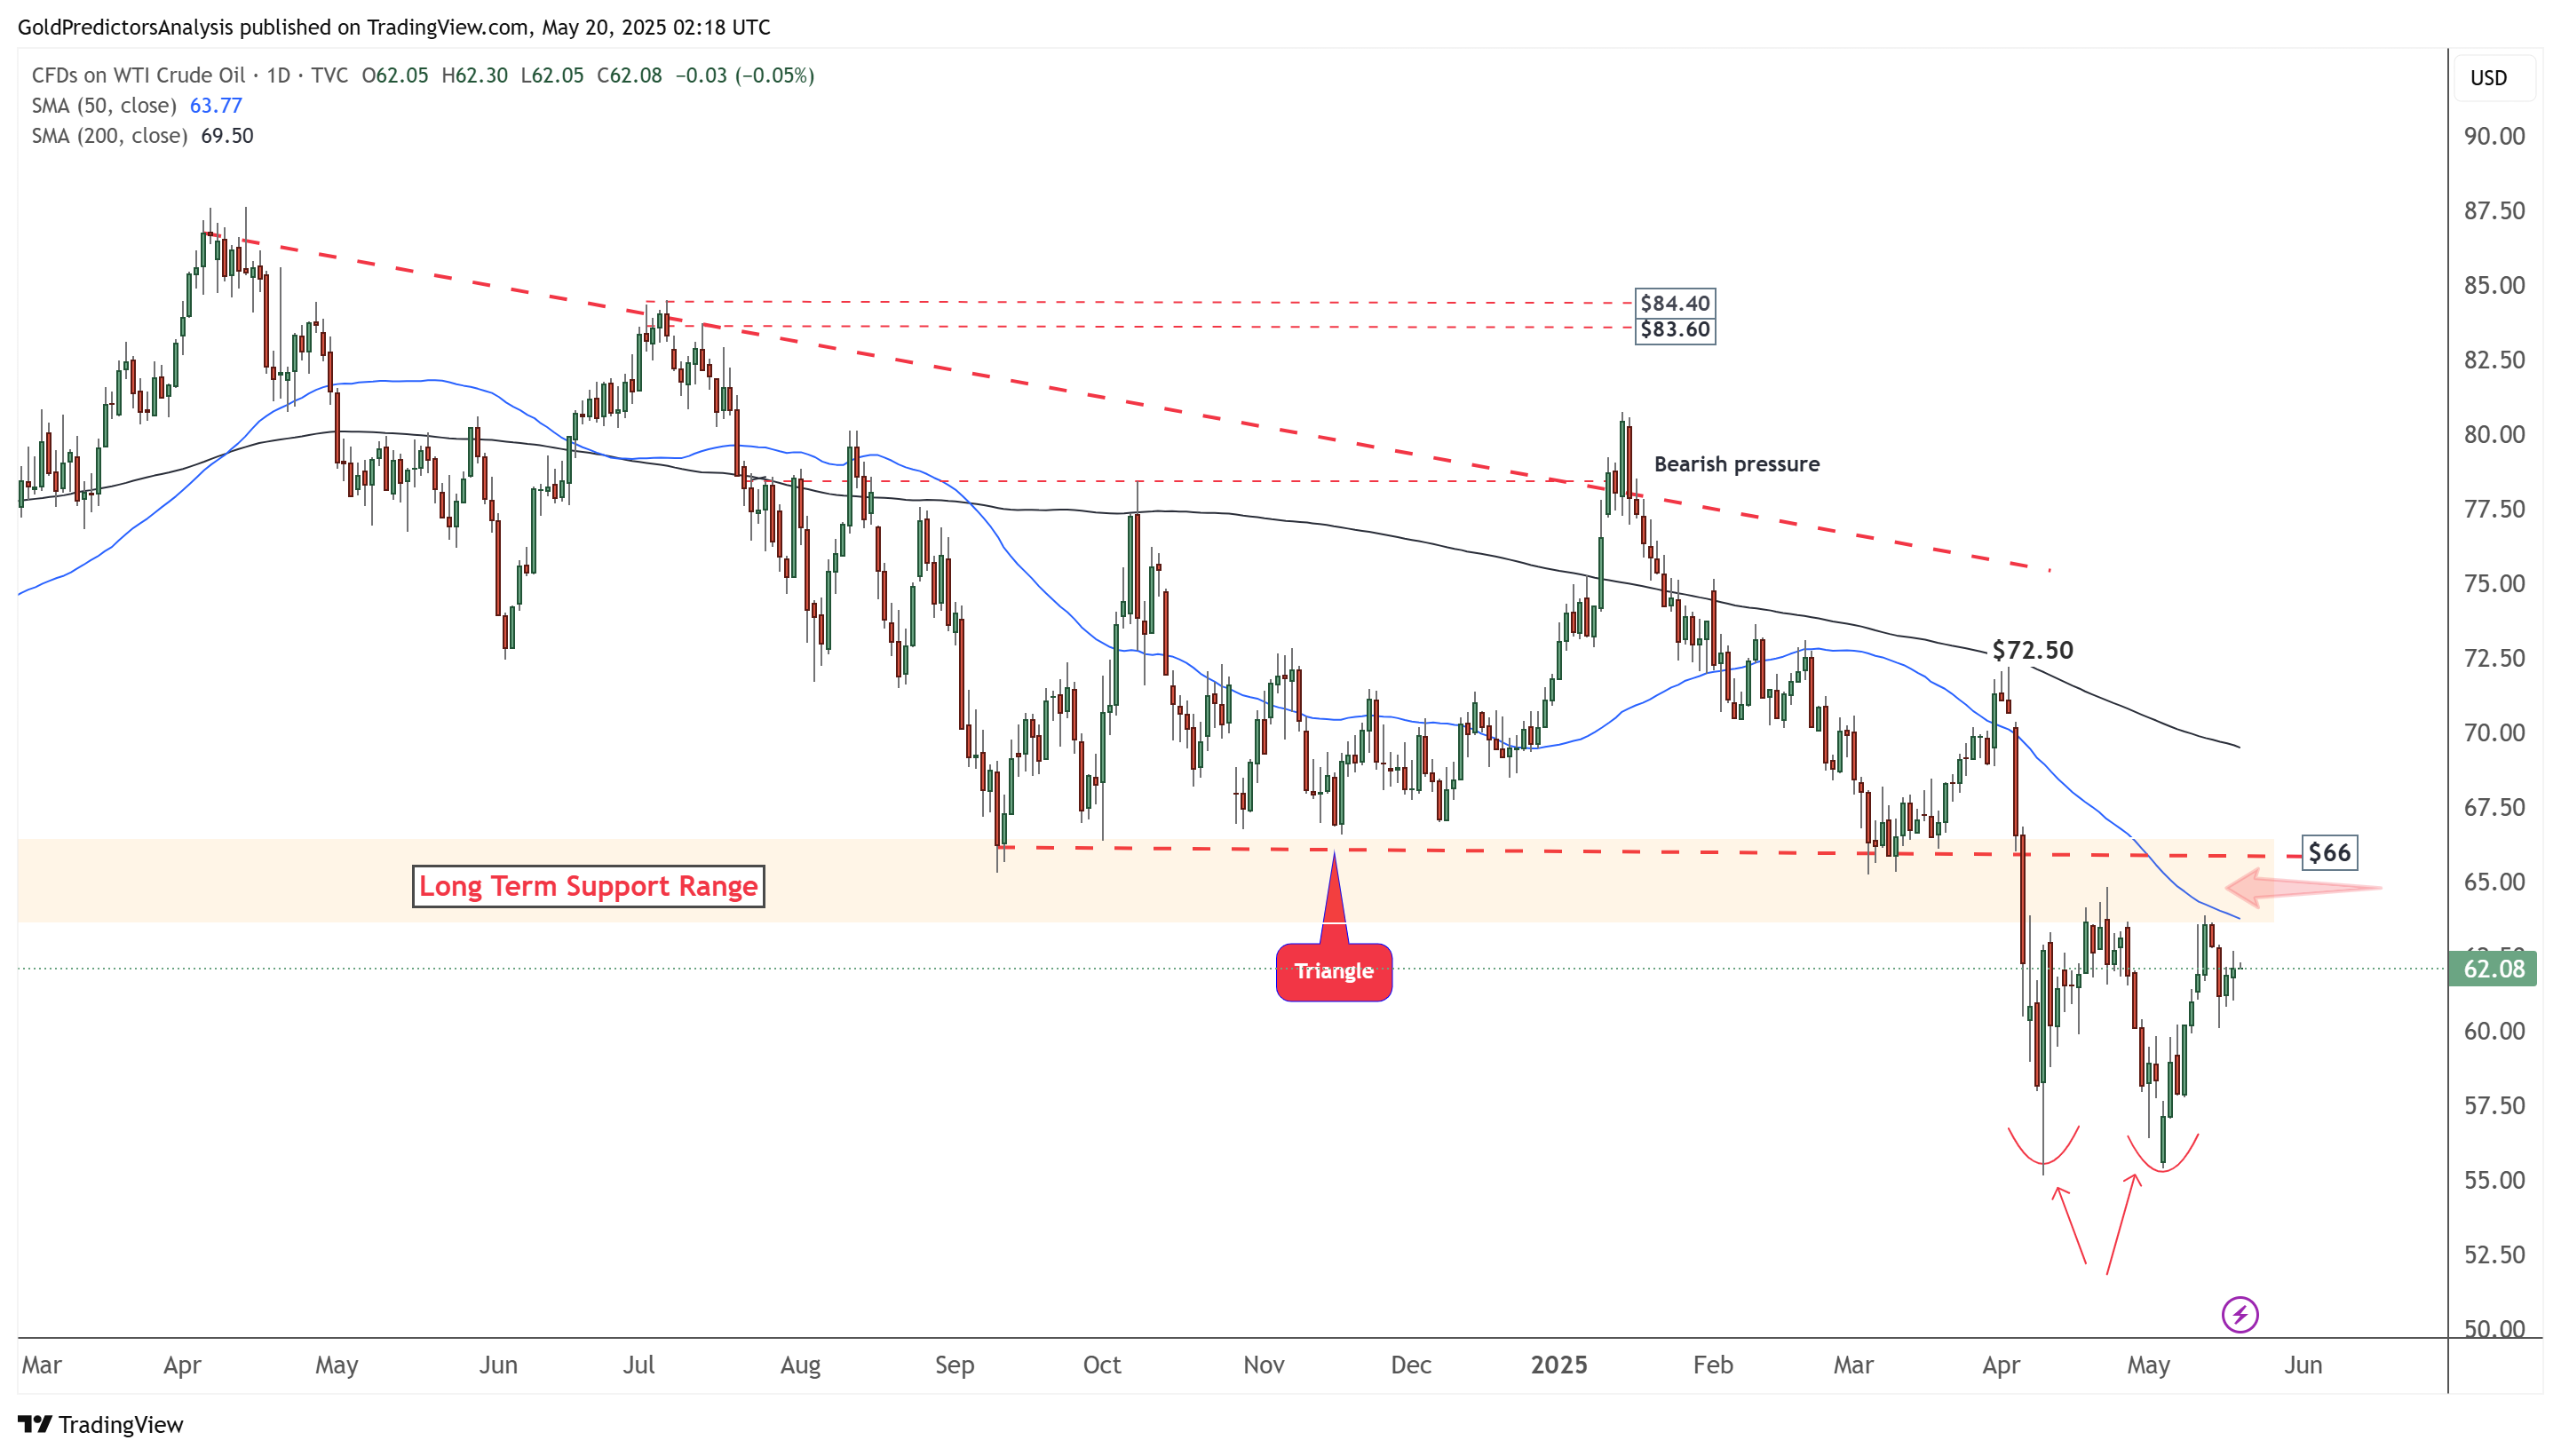
WTI Oil Daily Chart – Rebound
The daily chart for WTI crude oil shows the price consolidating below the long-term resistance zone at $65. The rebound from $55 has failed to break above the $65 level, and the price continues to consolidate below the 50-day SMA. Additionally, the 50-day SMA remains below the 200-day SMA, indicating ongoing bearish pressure. A break below $55 would confirm continued bearish momentum, while a breakout above $65 could signal a move toward the $70 level.
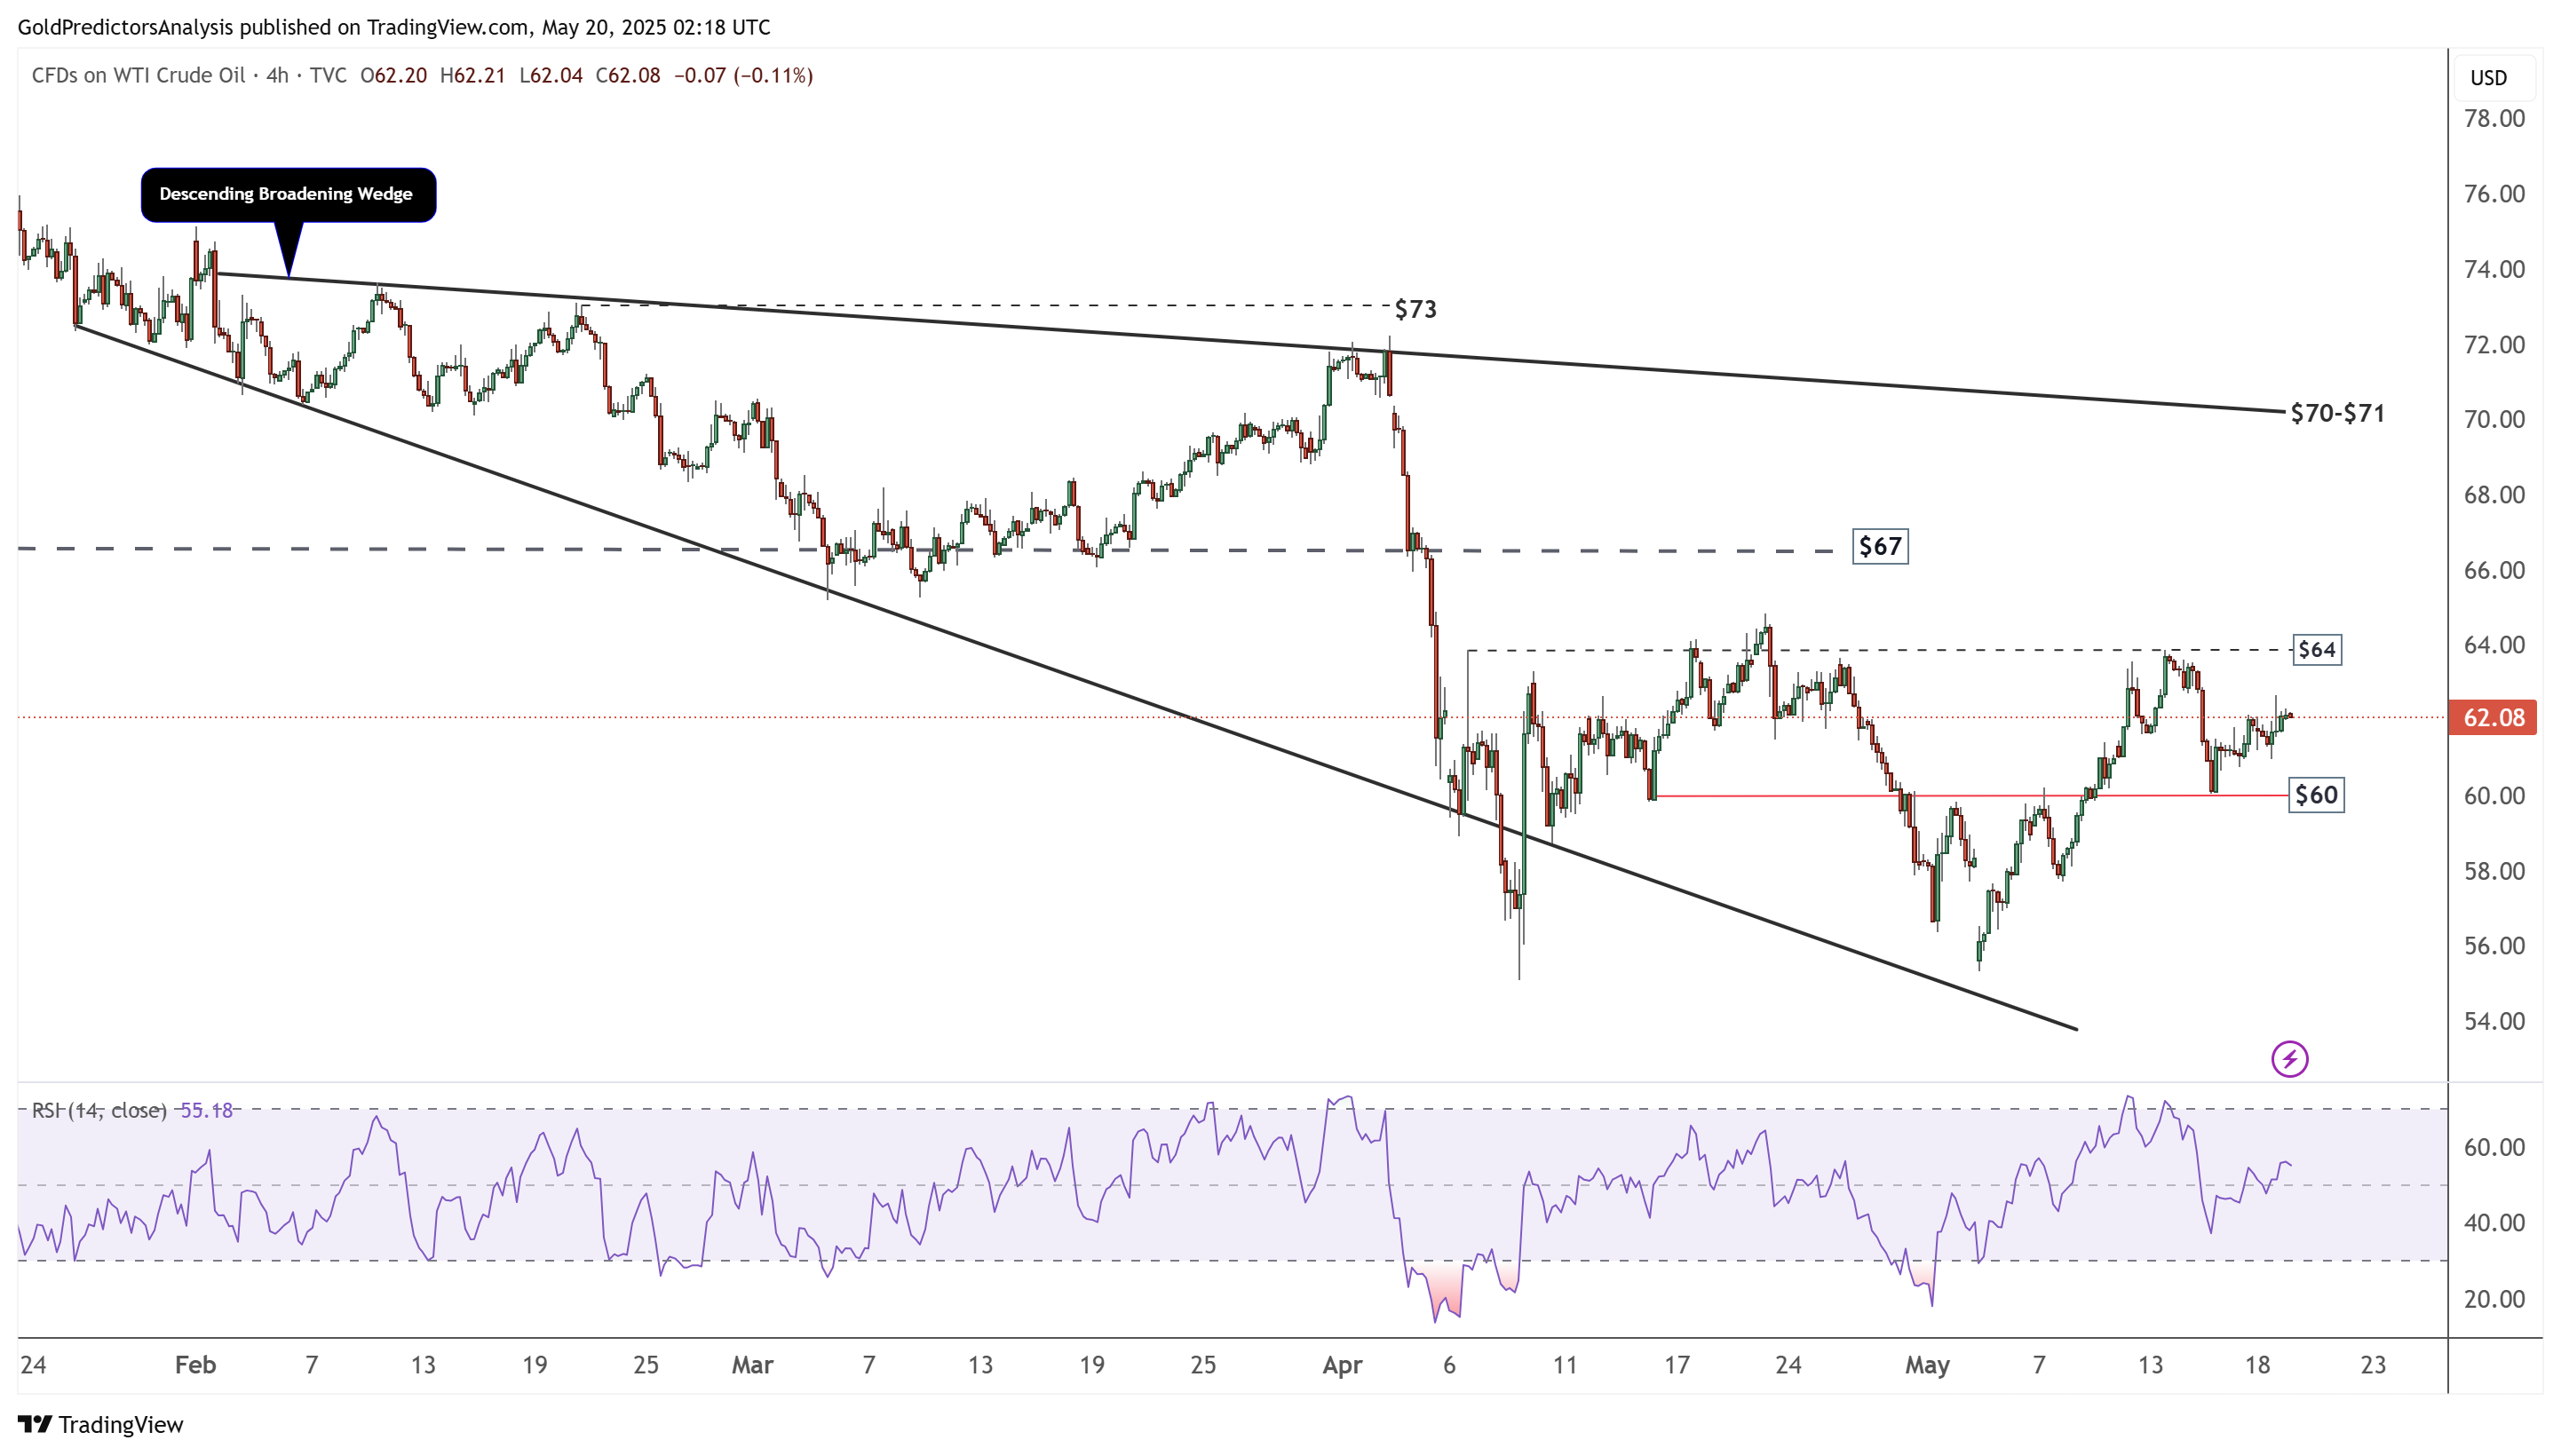
WTI Oil 4-Hour Chart – Descending Broadening Wedge
The 4-hour chart shows the price consolidating within a descending broadening wedge pattern. The rebound from $55 has been capped below $64. The price is currently consolidating between $60 and $64, and a breakout above or below this range will indicate the next directional move. Strong resistance remains in the $70 to $71 zone, and a break above this area would signal bullish momentum.