 WTI Oil Daily Chart – Bearish Pressure
The daily chart for WTI crude oil shows that the price has broken from a bearish triangle pattern and fallen sharply to the $55 area. The rejection at $72.50 and break below the triangle highlight strong bearish pressure. The 50-day and 200-day moving averages are sloping downward, confirming bearish momentum. Moreover, RSI remains below 40, indicating weak strength and oversold conditions. A minor bounce is visible, but the broader trend stays negative unless oil reclaims $66.

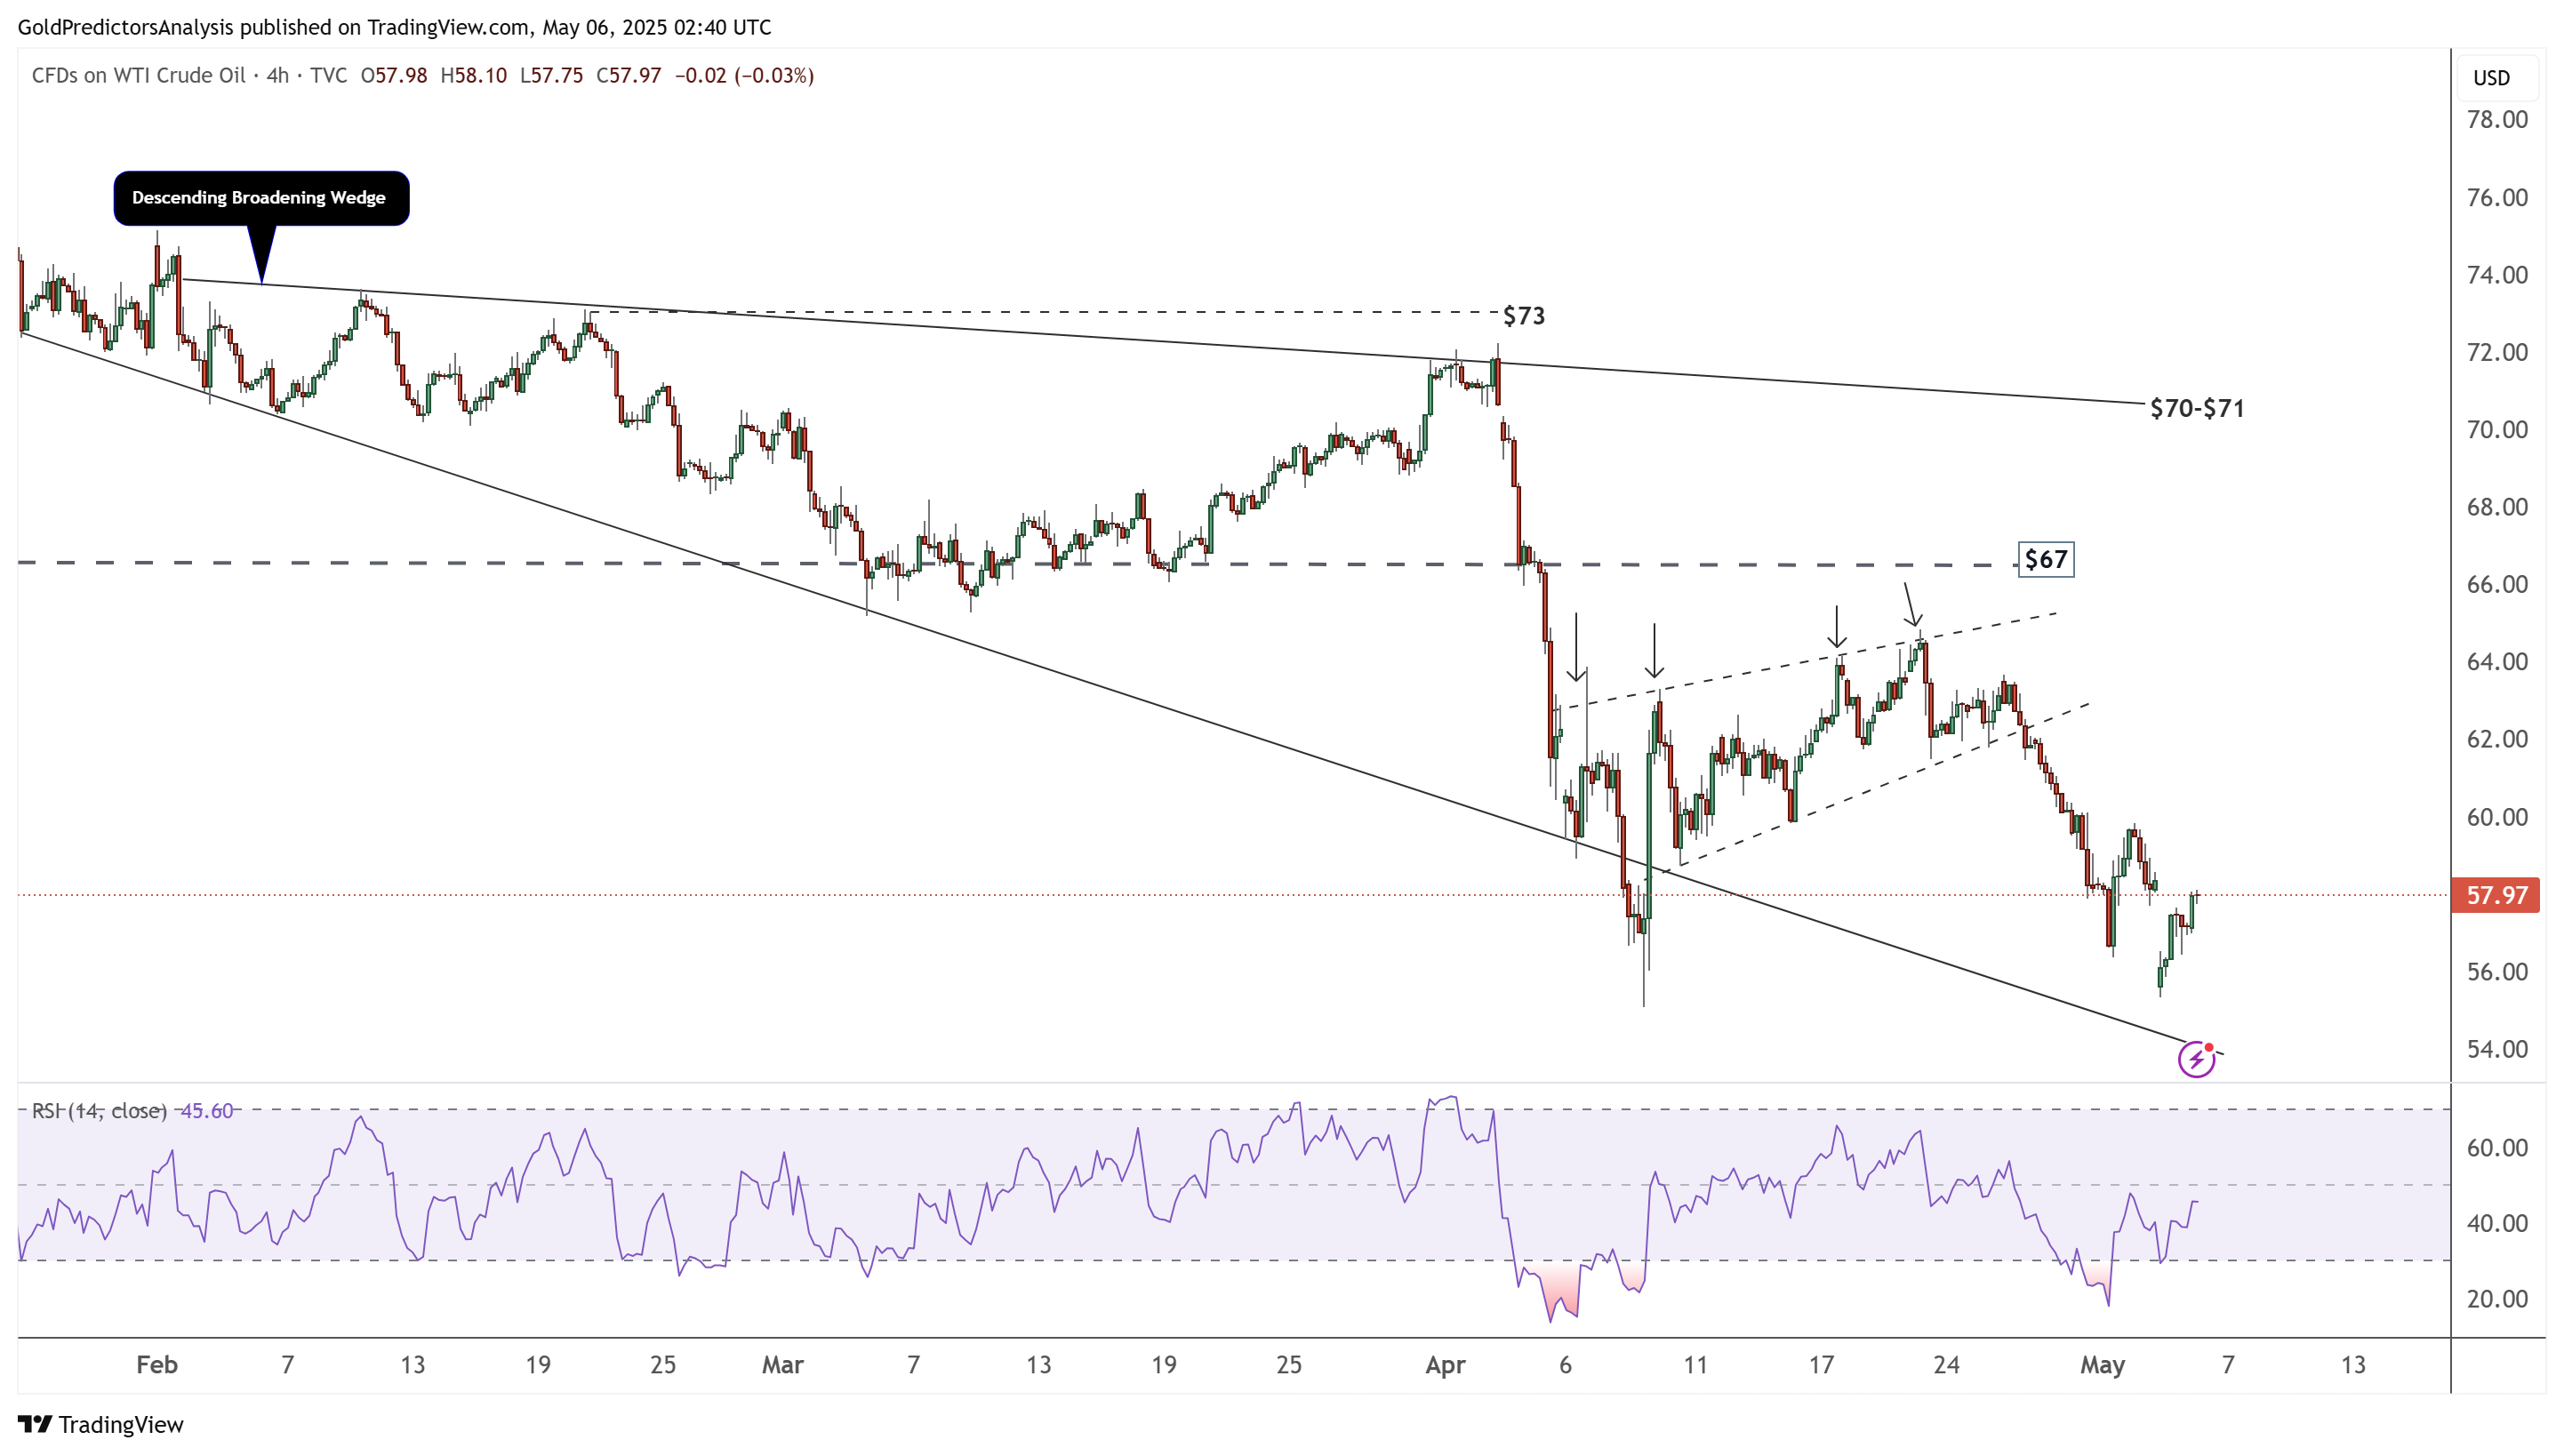
WTI Oil 4-Hour Chart – Descending Broadening Wedge
The 4-hour chart for WTI crude oil also shows the bearish trend. The chart shows a descending broadening wedge, followed by a bearish rising wedge, which signaled a reversal. Price rejected multiple times below $67 and then collapsed toward $54. Moreover, RSI rebounded from oversold levels and now shows a mild recovery. However, the current price action remains weak below $60. The broader trend stays bearish unless oil reclaims the $67-$70 range.