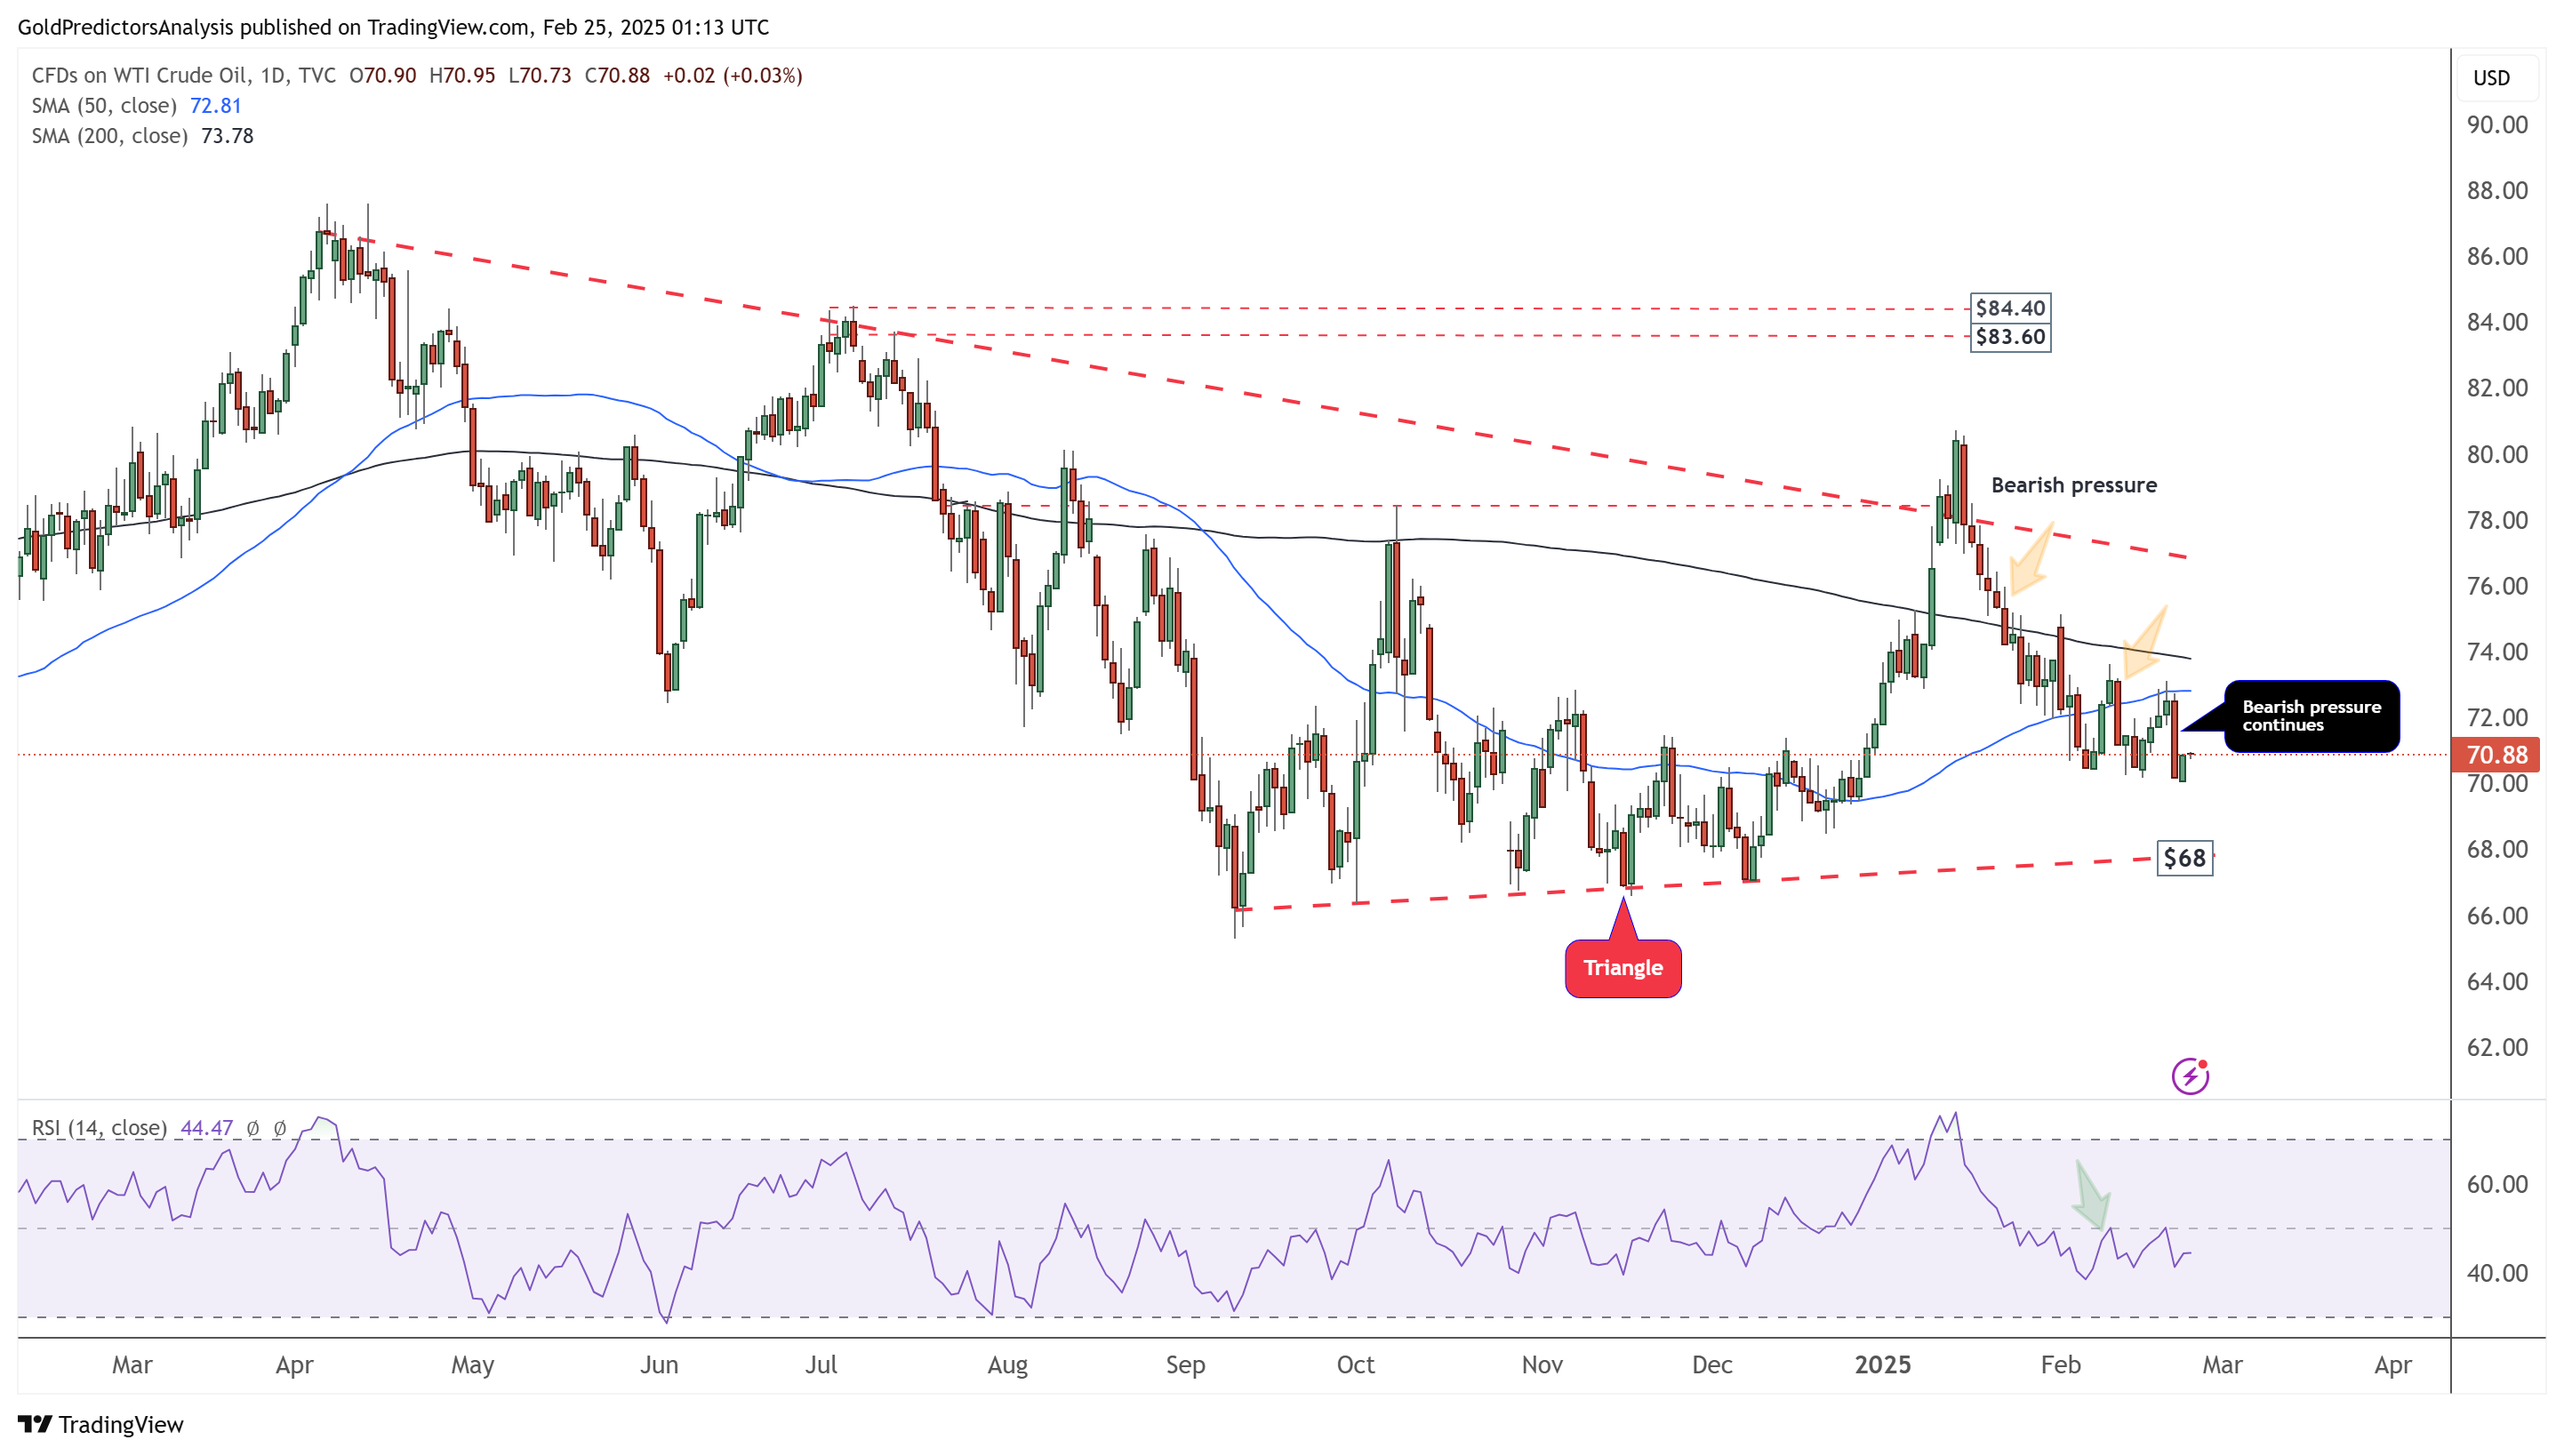
 Oil Daily Chart – Bearish Pressure
The daily chart for WTI crude oil shows that the price has traded within a triangle pattern and remains under bearish pressure. The sharp price drop on Friday suggests that prices will likely continue lower. Strong support lies around the triangle pattern’s support at $68, and a break below this level could trigger further downside momentum.
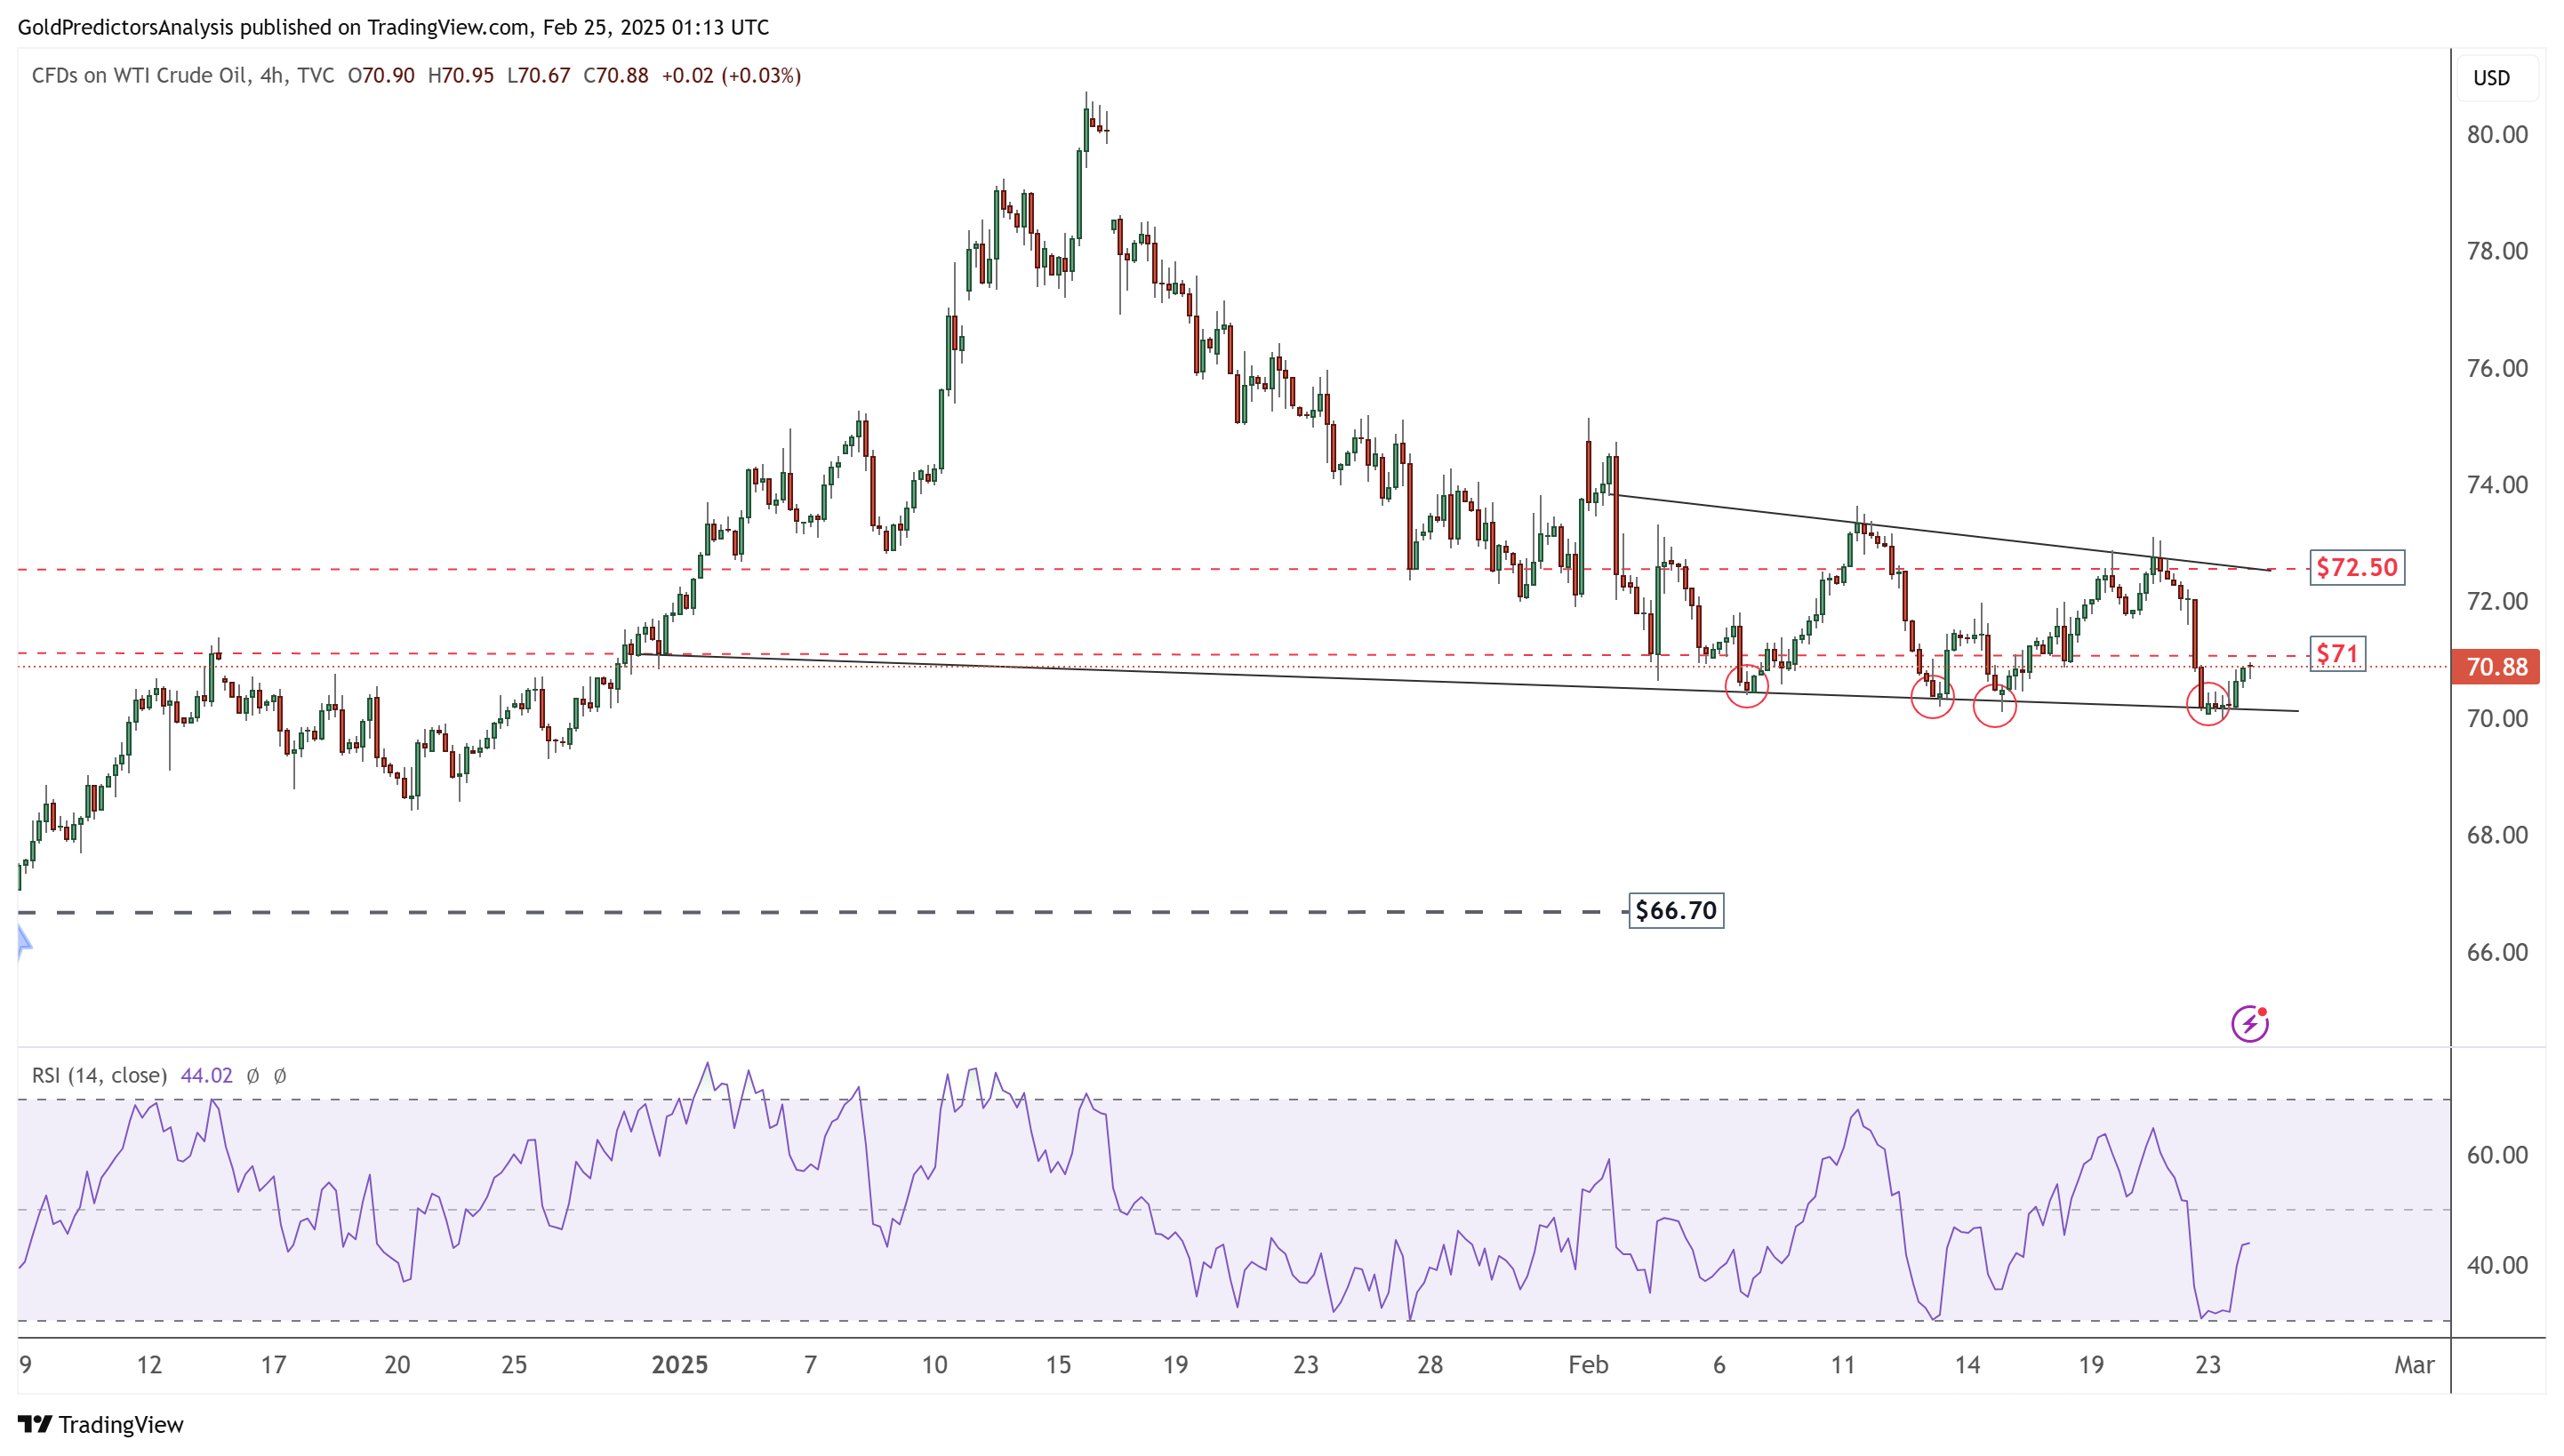
Oil 4-Hour Chart – Bearish Pressure
The 4-hour chart for WTI crude oil shows that the price is consolidating between $72.50 and $70. However, the overall direction for oil prices remains uncertain. The RSI indicates that prices have reached oversold levels and are rebounding higher. A break above $72.50 would signal further upward momentum toward $78.