


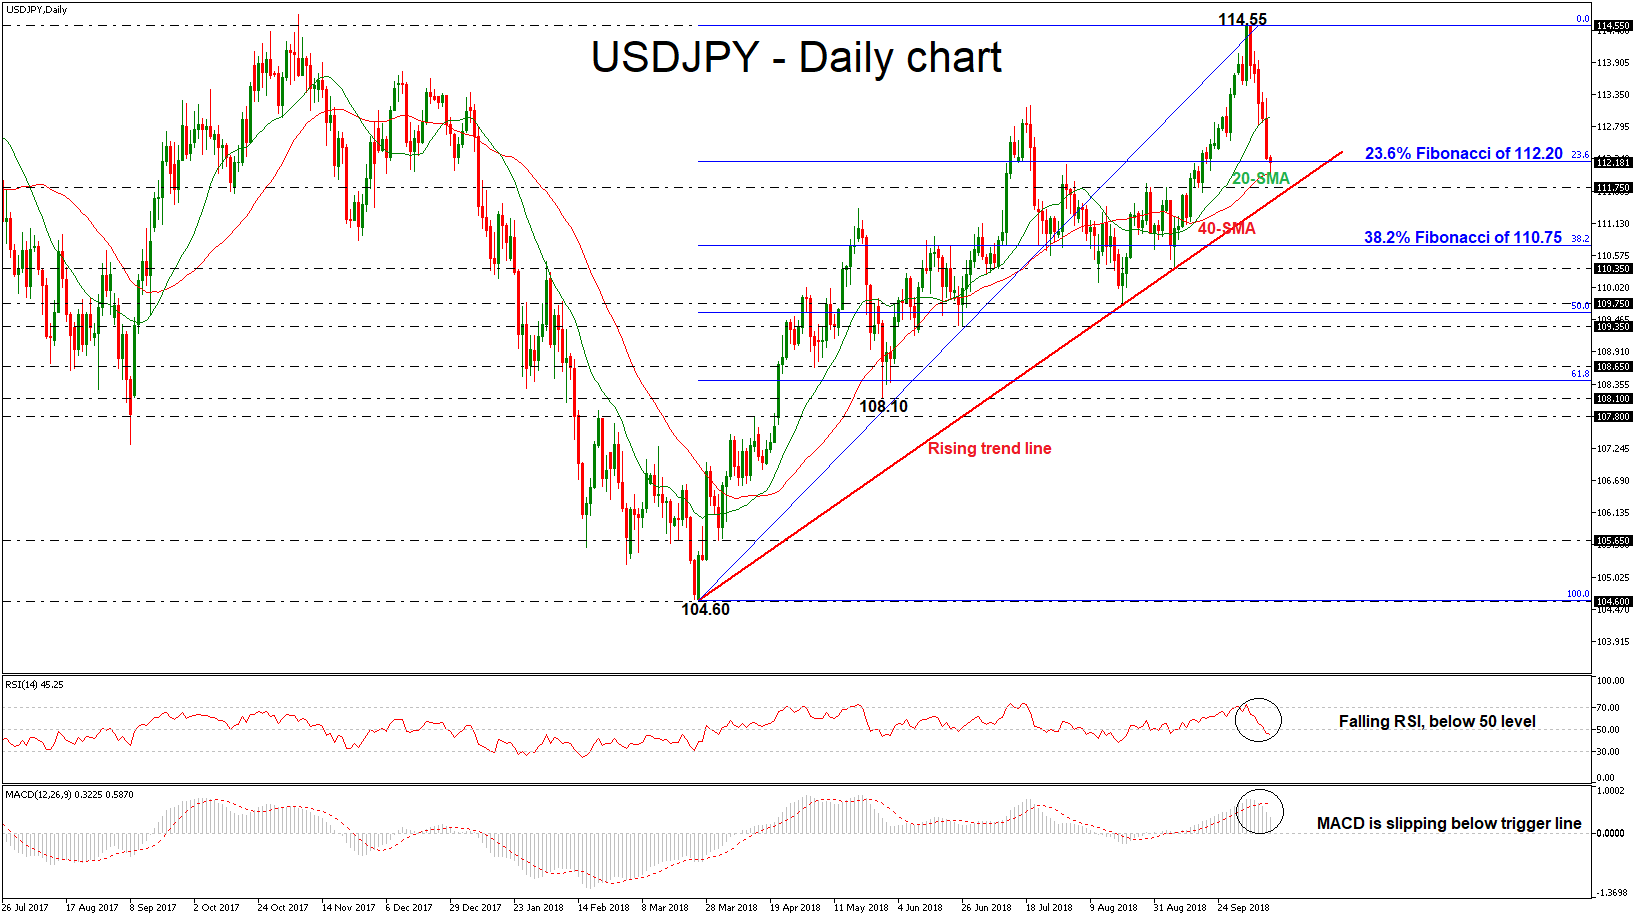
 USDJPY has come under fresh selling pressure, creating five consecutive red days, following the touch on the 11-month high of 114.55. The pair tumbled below the simple moving averages in the daily timeframe, while it stands near the 23.6% Fibonacci retracement level of the upleg from 104.60 to 114.55, around 112.20. Earlier today the price recorded a three-week low near the 112.00 handle. The technical indicators continue to send bearish signals, suggesting that the softness in the market is not over yet.
In the short-term, the RSI indicator dived below the threshold of 50 after the bounce off the overbought zone, while the MACD oscillator slipped below the trigger line and is losing momentum but is still above the zero line.
Should prices decline further, the next immediate support is coming from the 111.75 key level, which holds near the medium-term ascending trend line. If there is a penetration of this level, it could open the door for a negative structure until the 38.2% Fibonacci mark near 110.75. More losses could send prices towards the 110.35 barrier, identified by the bottom on September 7.
However, if the market manages to turn up again, the 20-day SMA at 112.95 could offer nearby resistance to the bulls ahead of the 11-month high (114.45). A significant close above the latter would drive the price towards the next obstacle of 115.50, achieved on March 2017, recording a new higher high.
In the medium-term, the outlook remains positive since prices hold above the rising trend line, which has been standing since March 26. If USDJPY breaks below this trend line, it would change the outlook to a more neutral to negative one.
Origin: XM


