 WTI crude oil (CL) prices received fresh buying interest on Monday, ending a seven-day losing streak that had pushed prices to a two-month low. The market’s attention turned to the upcoming US-Russia peace talks in Alaska. Sentiment improved on the prospect of a diplomatic breakthrough.
The rebound followed a steep 5% drop last week. That was the sharpest drop since late June. The decline came on fears of slowing demand, new tariff shocks, and rising OPEC+ supply. However, the market has reached the short-term support of $64 and is rebounding from the support zone.
US sanctions also influenced market dynamics. Washington imposed a 25% tariff on Indian goods in response to India’s continued purchases of discounted Russian oil imports. Similar measures against China are reportedly under consideration. These actions could disrupt trade flows and tighten supply, adding uncertainty to oil prices.
On the other hand, the Alaska talks remain a key risk factor. A deal could lower geopolitical risk premiums and recalibrate global oil flows. This might include easing sanctions on Russian exports. However, the deal failure could trigger renewed volatility. The market is waiting for OPEC+ and EIA reports for clues on supply-demand trends.
WTI Crude Oil (CL) Technical Analysis
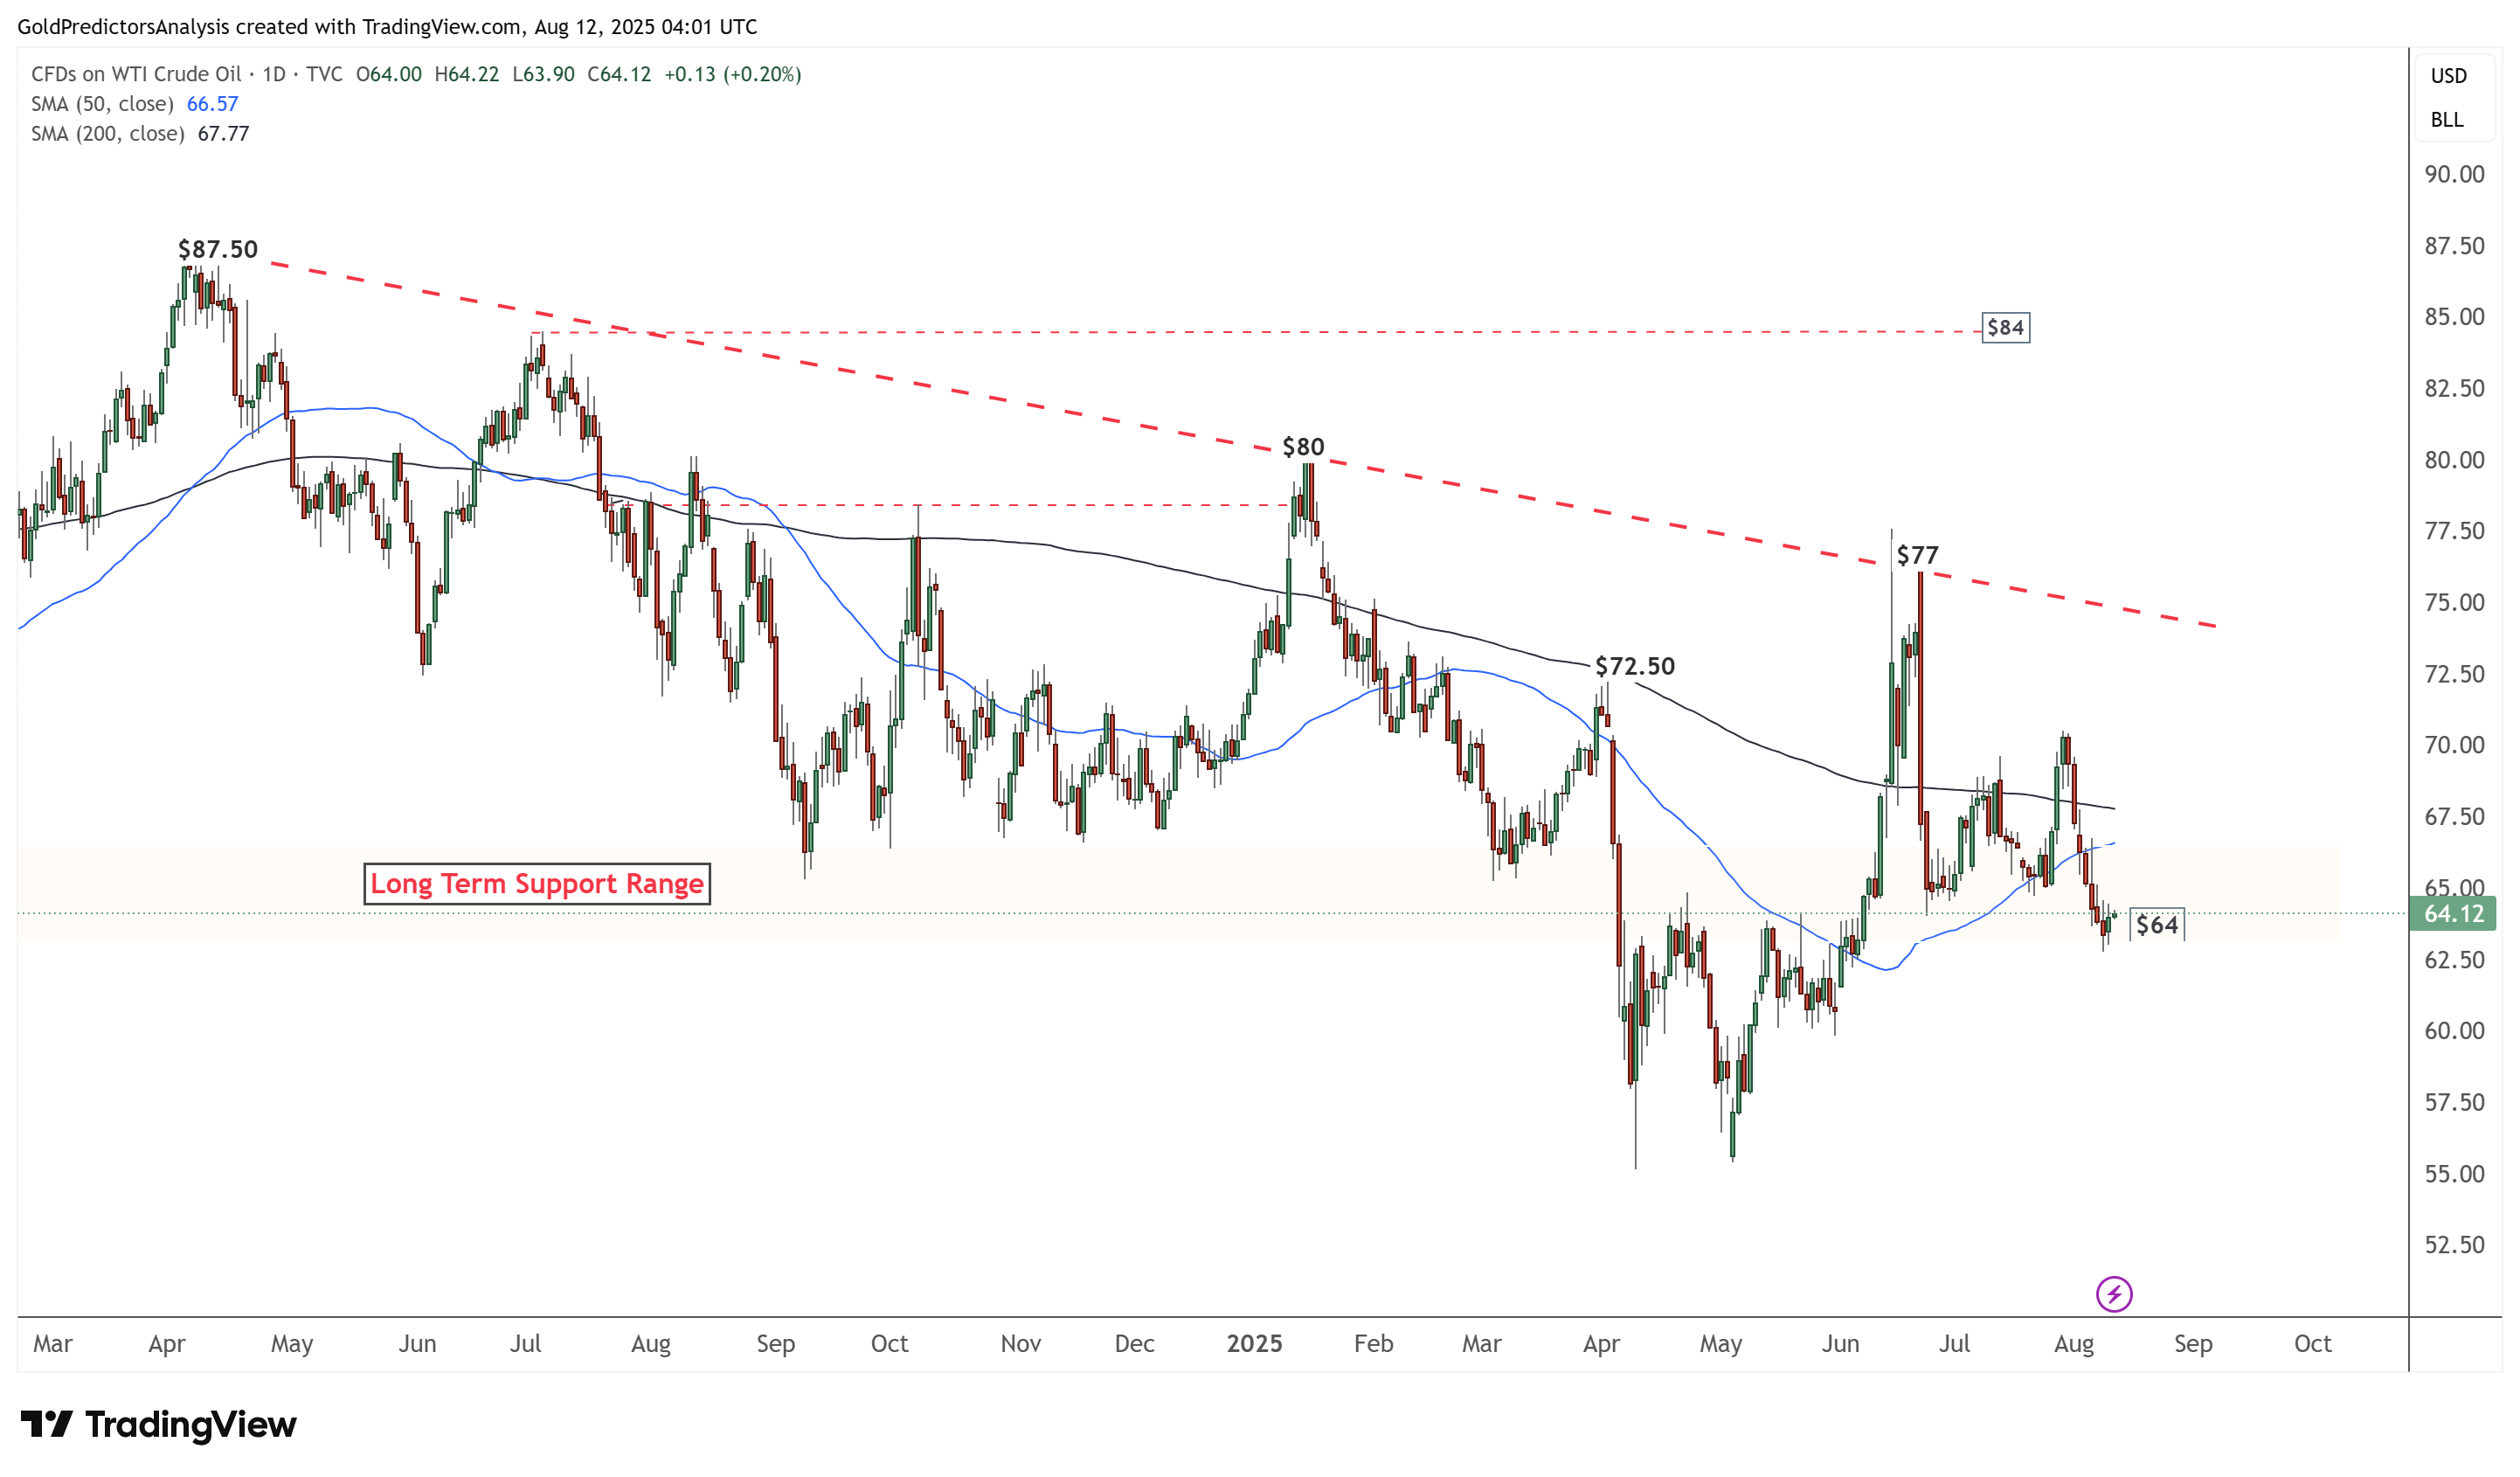
The daily chart for WTI crude oil shows weakness at the long-term support around the $64 area. A clear break below this level would be negative and could trigger a move toward the $55 region. Price consolidation below the 50-day and 200-day SMAs indicates a bearish trend and suggests a likely continuation of the decline in WTI prices.
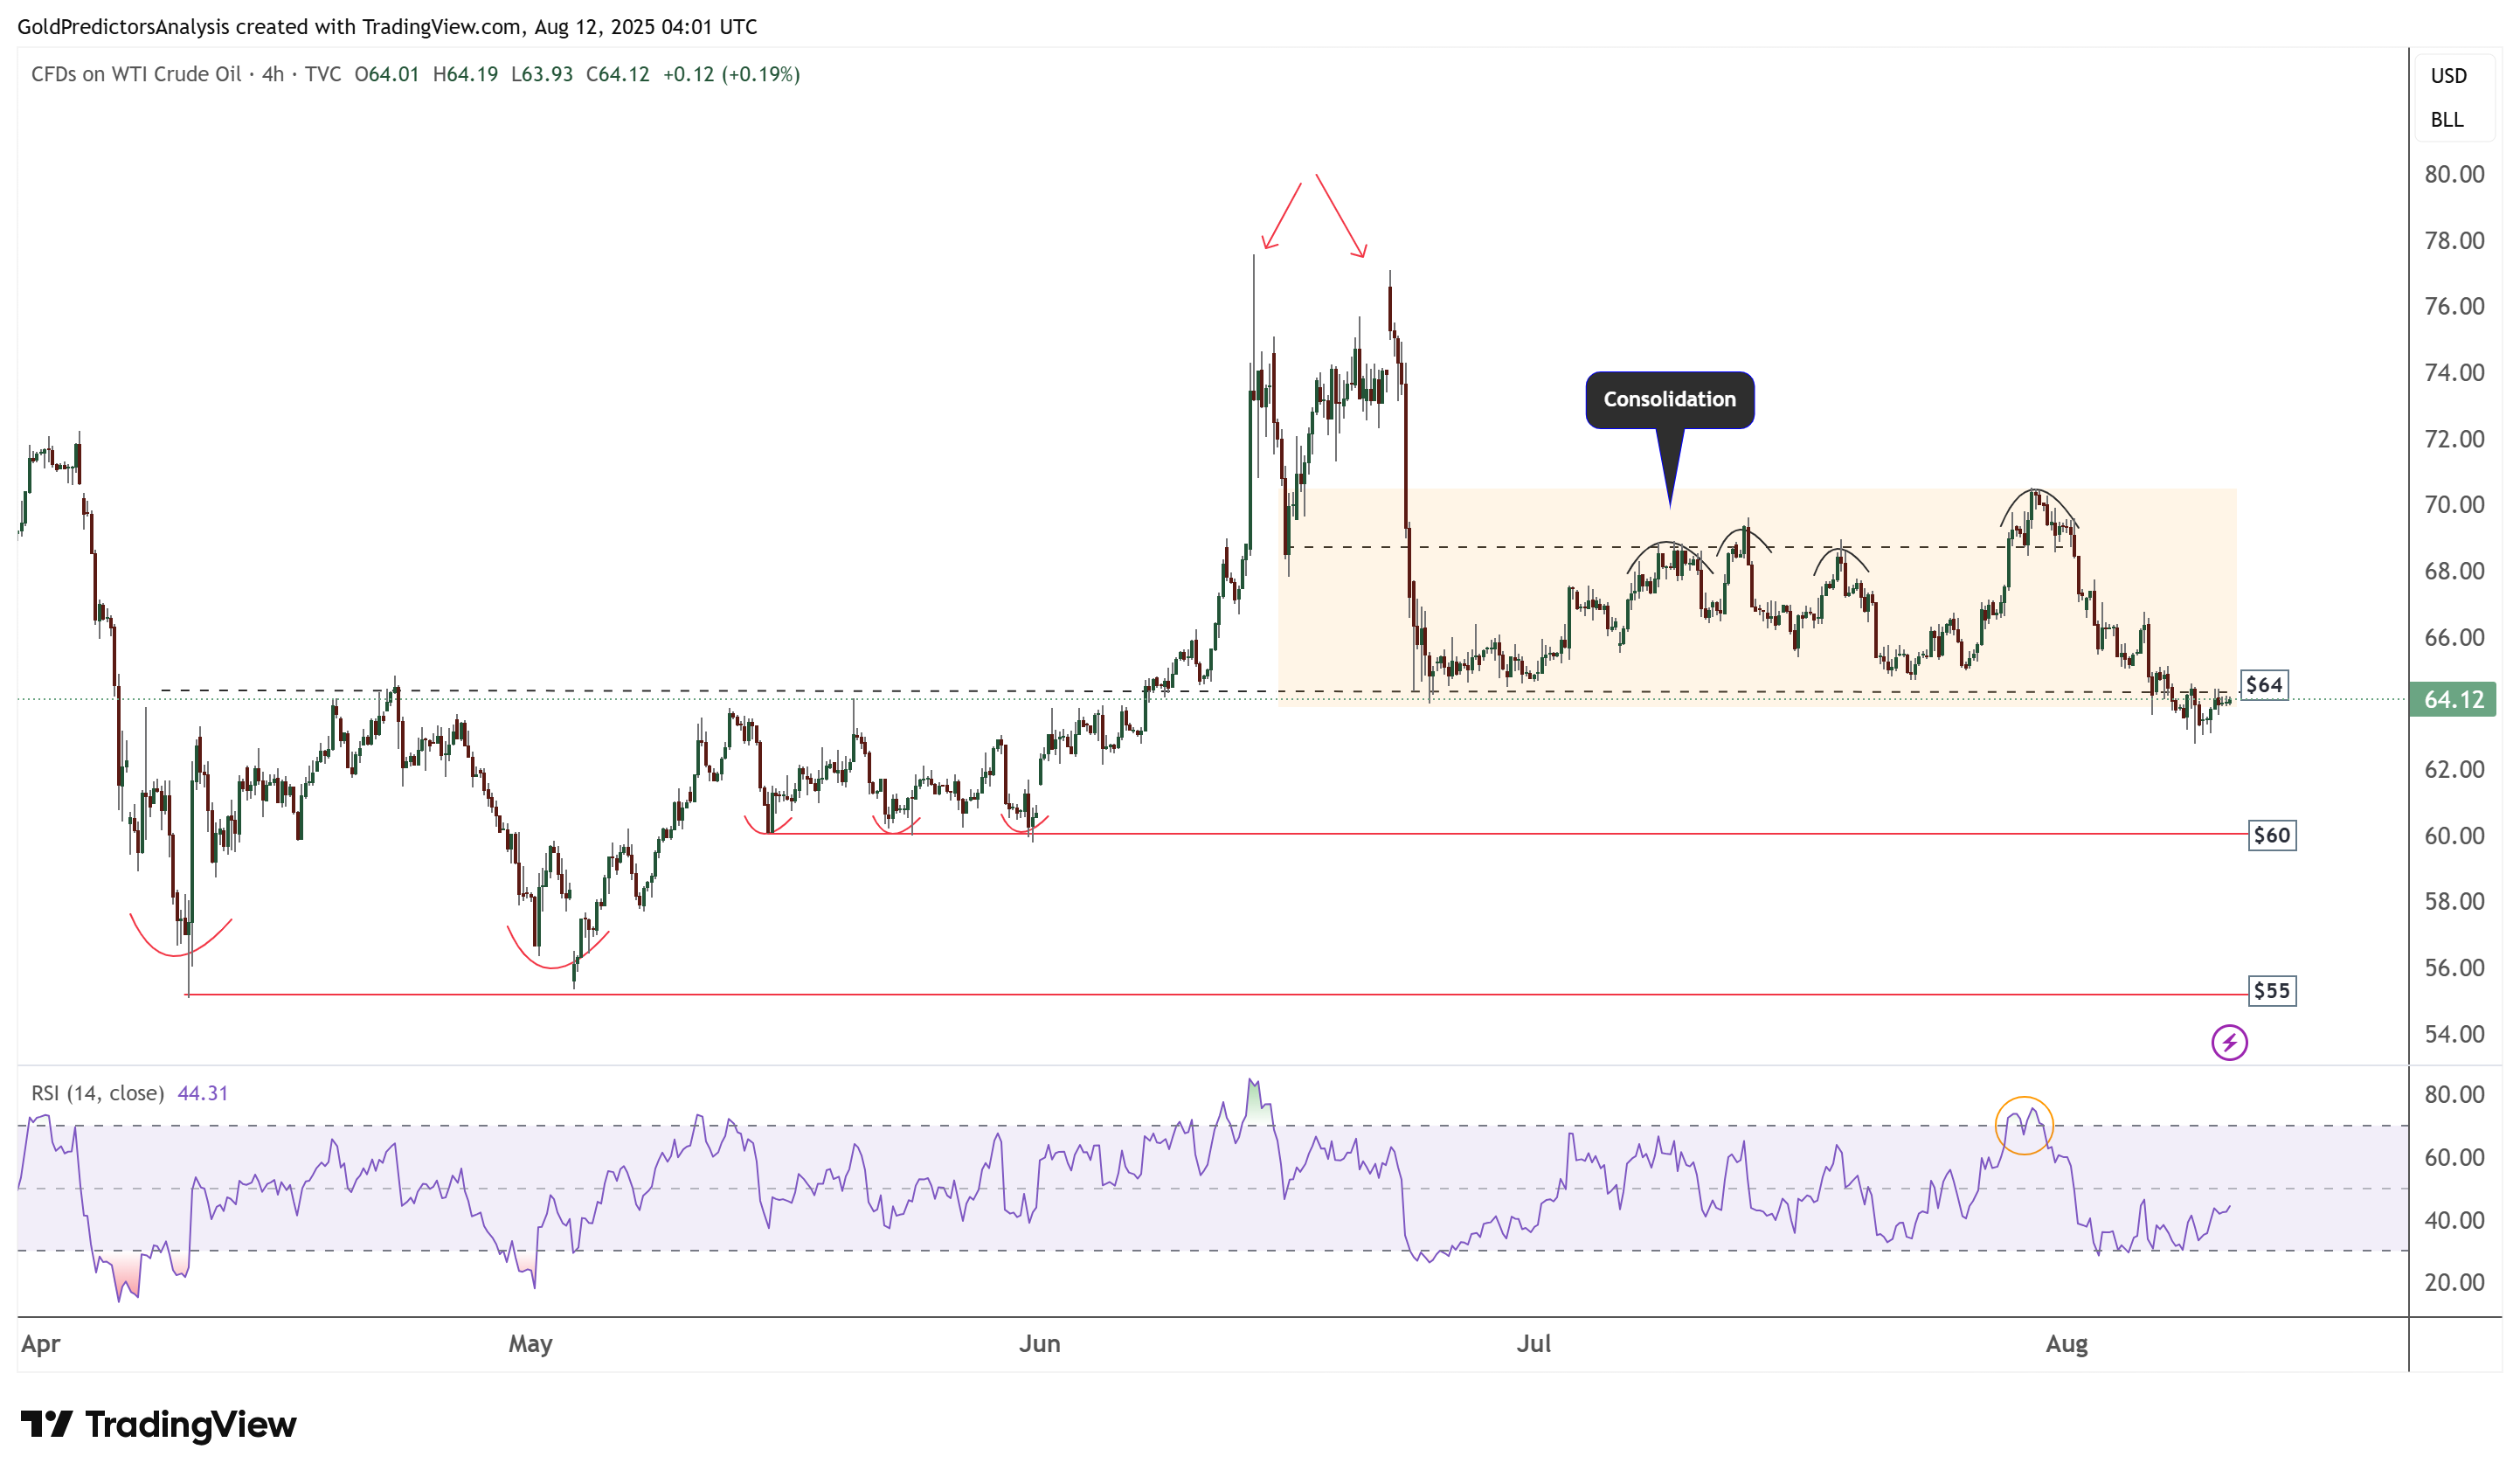
WTI Oil 4-Hour Chart – Consolidation with Bearish Bias
The four-hour chart for WTI crude oil shows that the price is consolidating within the orange zone and attempting to break below the $64 area. A confirmed break below $64 could push prices toward the following support levels at $60 and $55.