


 WTI Oil Daily Chart – Negative Trend
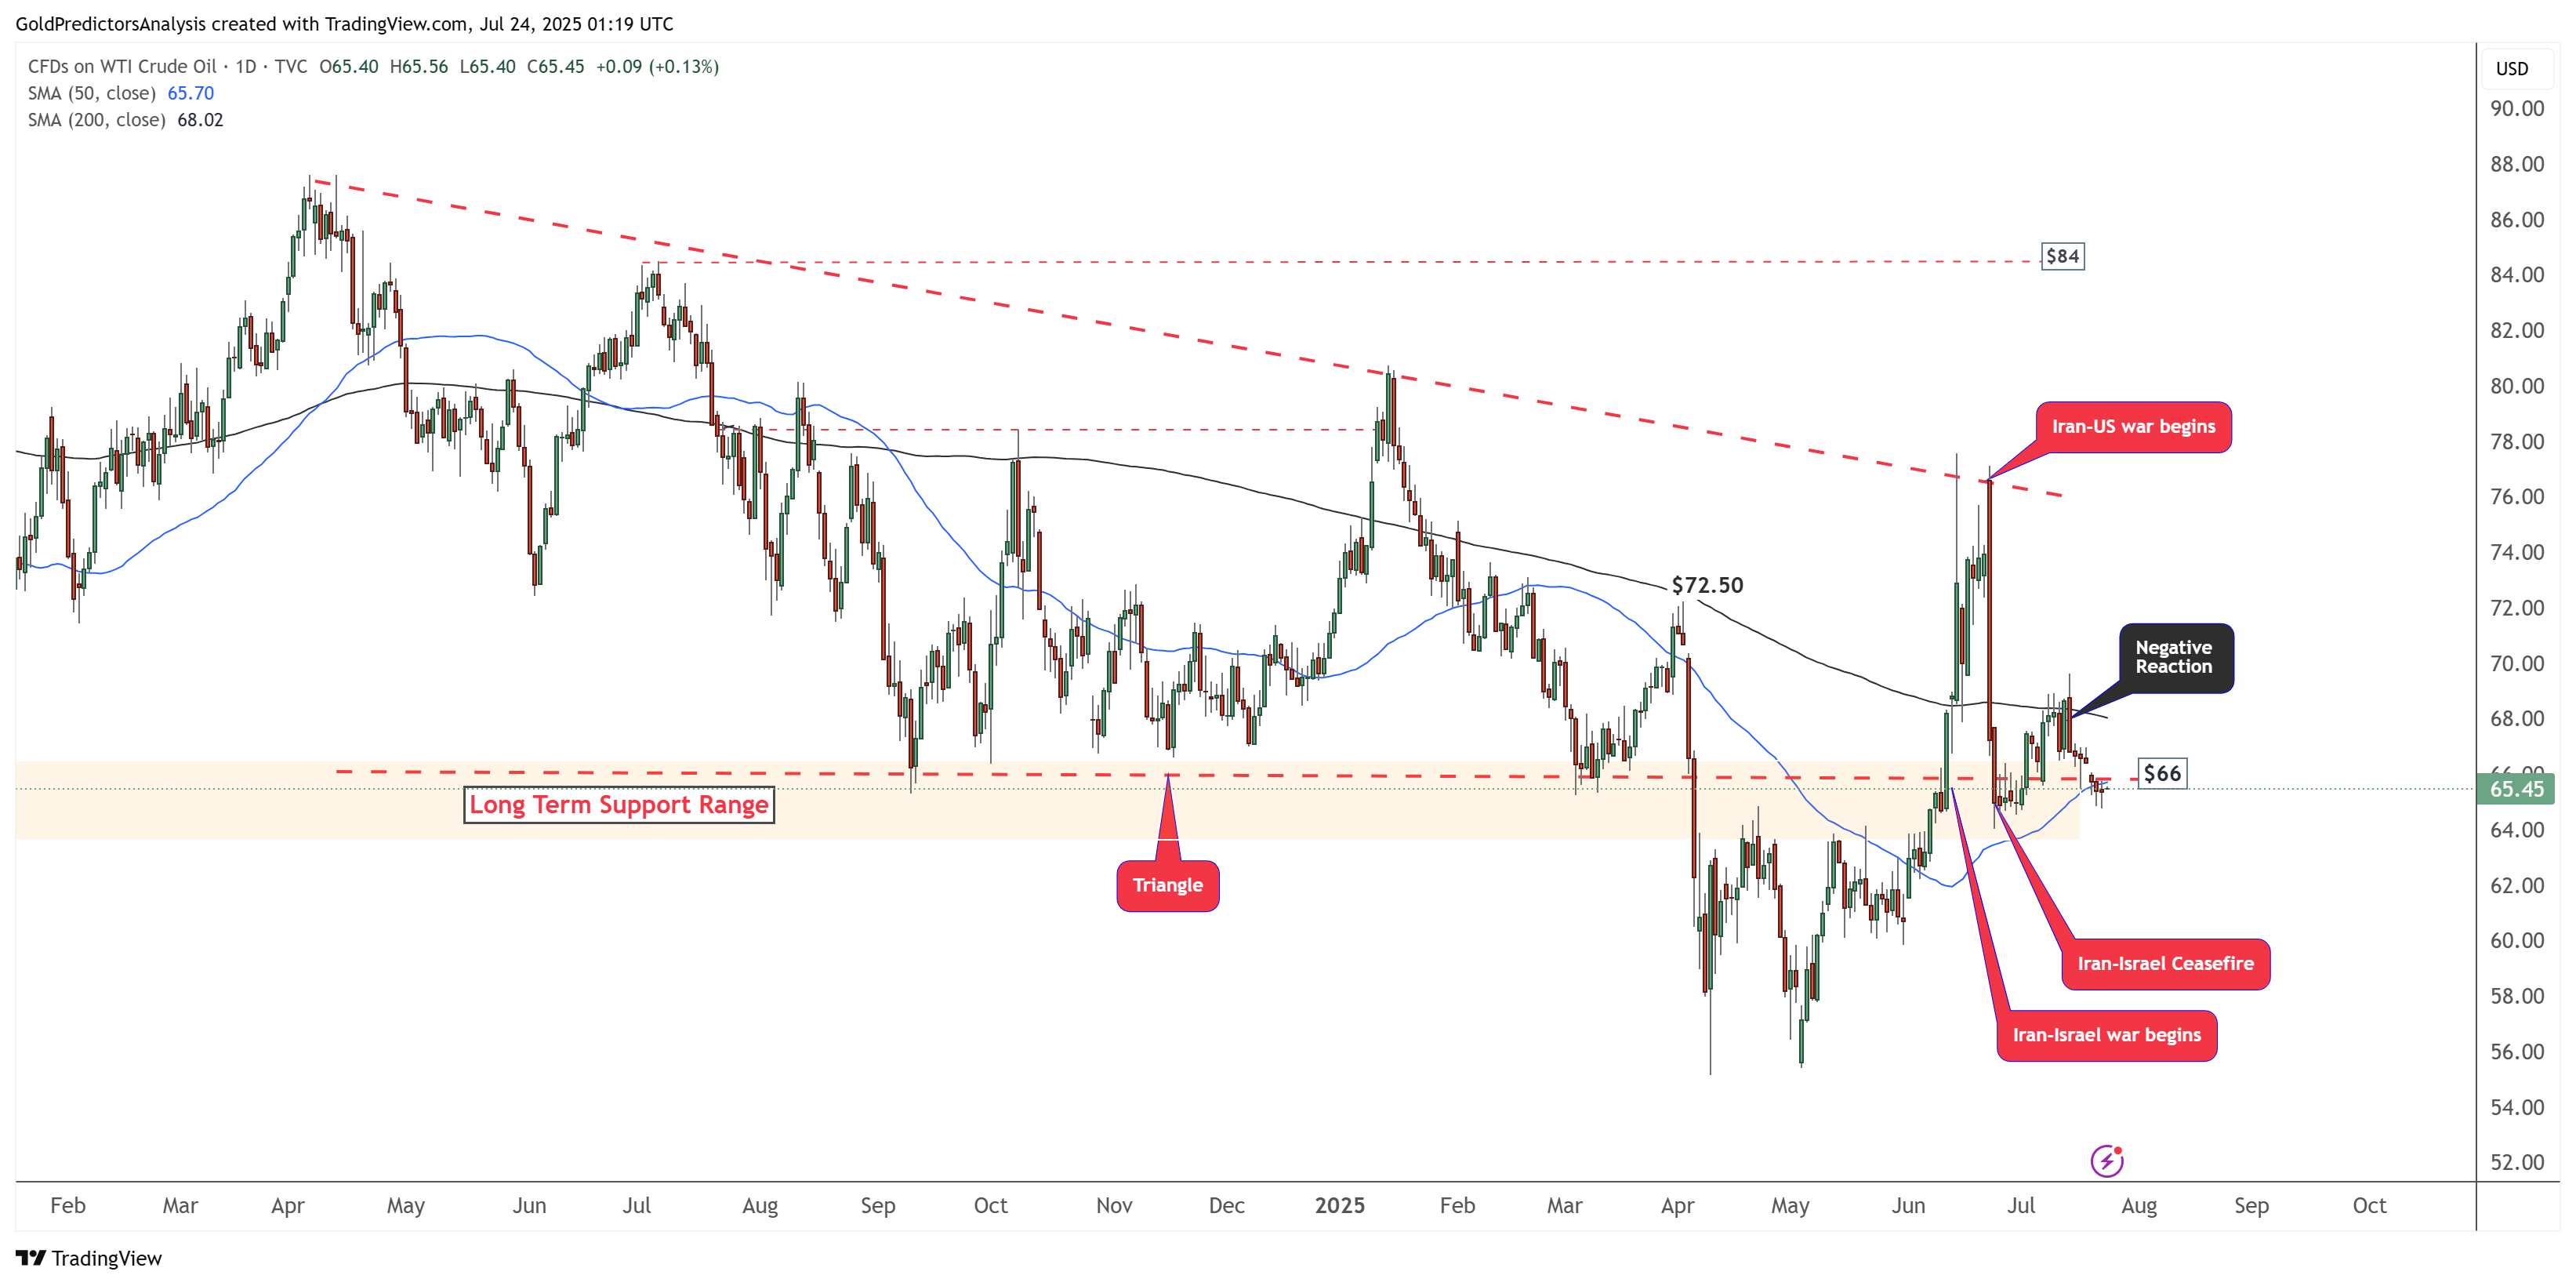
The daily chart for WTI crude oil shows that the price remains under bearish pressure and is attempting to break below a key triangle pattern. The price is consolidating within a long-term support range between the $64 and $66 area. A break below the $64 level would signal further downside risk.
WTI crude remains below both the 50-day and 200-day SMA, reinforcing the bearish outlook. The sharp drop from the $77 level during the US–Iran conflict has pushed price action into negative territory, increasing uncertainty and downside risk for WTI crude oil.
WTI Oil 4-Hour Chart – Double Top Formation
The 4-hour chart for WTI crude oil indicates that the price is consolidating within a descending broadening wedge, situated between the $66 and $64 areas. As long as the price remains below $70, WTI crude oil is likely to continue its downward trend. The emergence of a double top near the $77 level further reinforces the bearish outlook and suggests additional downside risk.


