


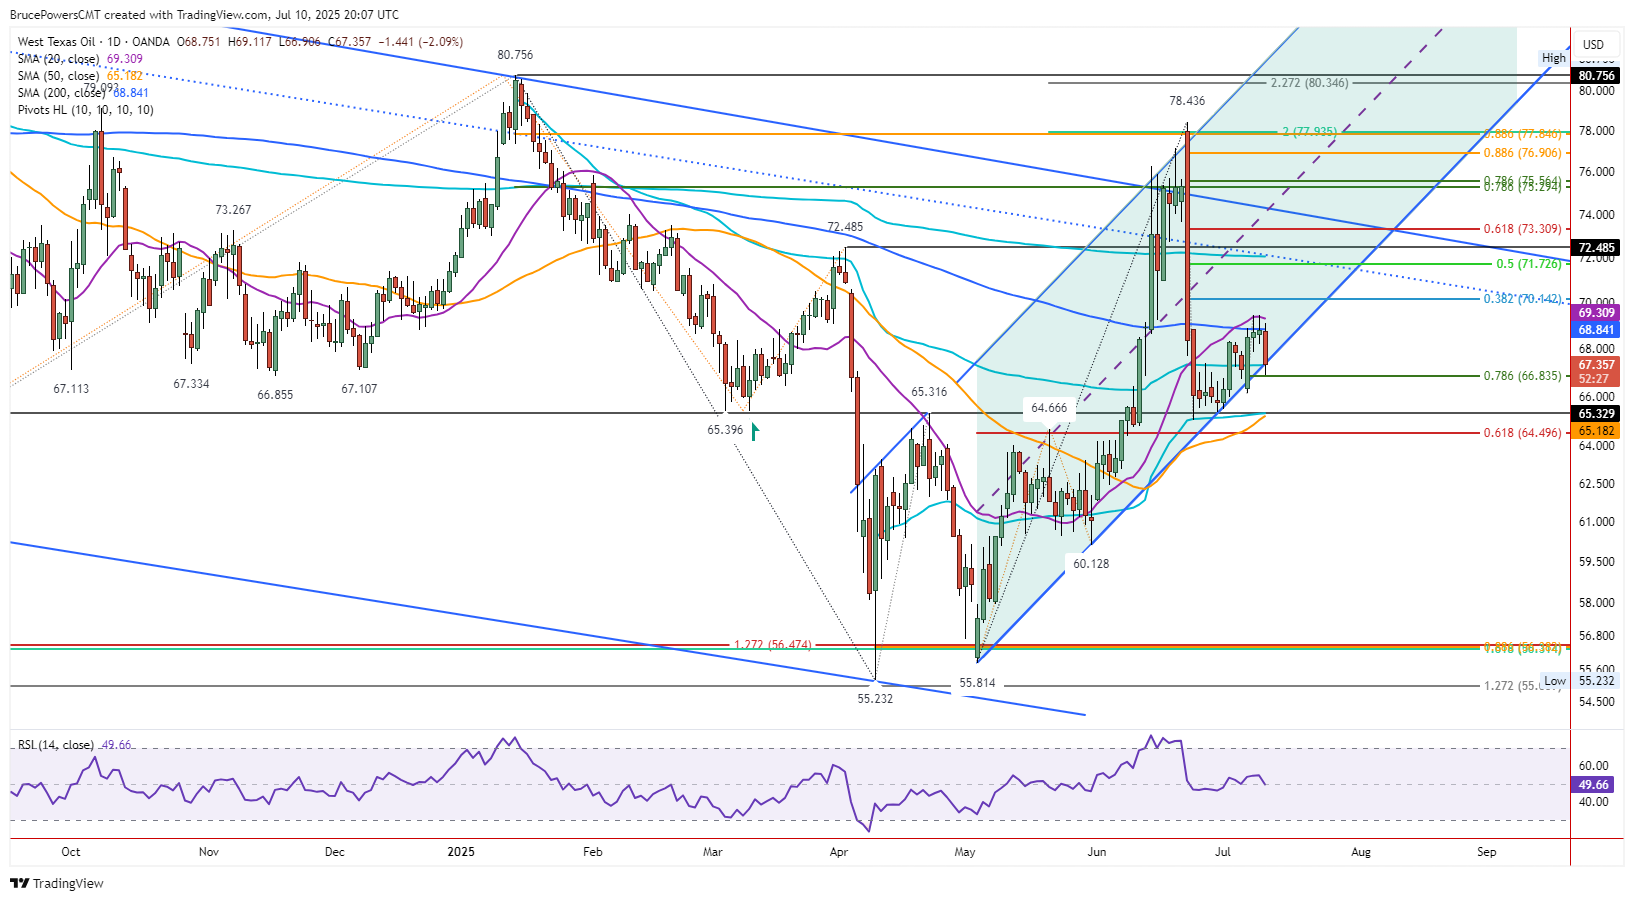
 Resistance following this week’s high of $69.46 led to a two-day bearish reversal in crude oil on Thursday. A sharp drop to a low of $66.91 for the day established a potential higher swing low and a successful test of support at both an uptrend line. An AVWAP level (light blue) measured from the January swing high confirmed the support zone.
Furthermore, the decline completed a 78.6% Fibonacci retracement of the most recent upswing. It is interesting to note that the AVWAP line converged with the trendline today, showing a timing element. The price zone was not touched until the lines converged. Similar relationships can occur with moving average lines.
Support Confluence
When the indicators come together in a similar price area, the potential for it to hold as support increases. Nonetheless, further evidence is needed to support the movement towards either a bullish reversal or a bearish trendline break. Regarding the AVWAP level, it was clearly recognized as resistance during the April counter-trend bull rally. And notice that it was recognized on the way up for a day on June 10 and then again for five days following the $65.02 higher swing low in June.
Above $69.46 Needed for Bulls
The 20-Day MA (purple) has marked an area of trend resistance since the June 24 low. Since it is now close to this week’s high of $69.46, a breakout above that level is needed for a bullish signal and likely continuation of the counter-trend rally. In addition, the 200-Day MA is marking resistance this week as well as the four times the line was touched or exceeded ended with a daily close below it. Higher potential targets start with the 38.2% Fibonacci retracement level at $70.14 and a 50% retracement level at $71.73.


