


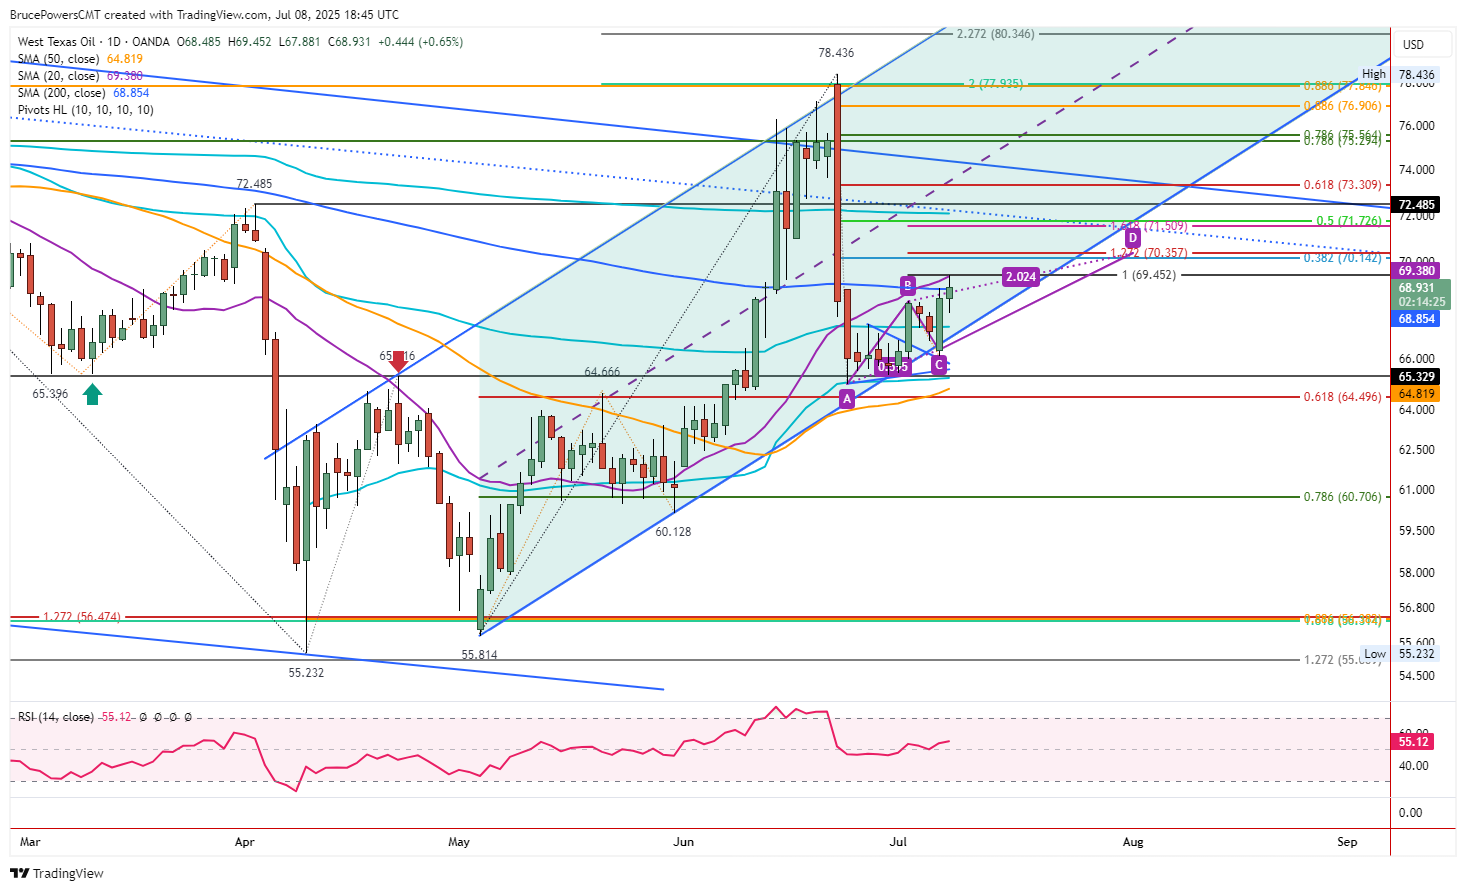
 Crude oil rallied into resistance at the 20-Day MA on Tuesday as it reached an 11-day high of $69.45. Also, Tuesday’s advance reclaimed the 200-Day MA, now at $68.86. That is a sign of strength that signals that higher prices are likely. But it needs to be confirmed by a daily close above the 200-day line.
Also, Monday’s high is at $68.89 and a daily close above that level will confirm a one-day breakout and bullish continuation of the uptrend bounce that began from the June 24 swing low at $65.02. Support around that low was confirmed by an AVWAP line begun from the April trend low. In other words, it measures from a significant long-term low.
Signs of Bullish Momentum
A higher swing low was established with Monday’s low of $66.12. Bullish momentum was represented by Monday’s bullish engulfing pattern. That followed strong bullish momentum seen in a full green candle from the upside breakout of a small pennant consolidation pattern that triggered last Wednesday. Together, these signs show demand improving for crude oil.
Minimum Upside Targets are Higher
Notice that the general minimum potential Fibonacci retracement of 38.2% at $70.14 has not yet been reached. Once a reclaim of the 200-Day MA is confirmed, higher targets become more likely to be tested. From the 50% retracement at $72.73 to a prior swing high at $72.49 marks the next higher potential target zone. And if the 50% level can be reclaimed with a daily close above it, an advance to the 61.8% Fibonacci retracement at $73.31 could be next.


