 Oil prices dropped on Thursday after bearish supply signals from the US and Saudi Arabia. Brent crude oil (BCO) declined to $64.60 per barrel, while WTI crude oil (CL) slipped to $62.55. This followed a nearly 1% decline on Wednesday after US data showed a larger-than-expected build in gasoline and distillate stockpiles, signalling weakening demand in the world’s top oil consumer.
On the other hand, Saudi Arabia’s move to cut July crude prices for Asian buyers further pressured the market. The pricing now sits near the lowest in four years. This action came just days after OPEC+ agreed to raise output by 411,000 barrels per day for July. Saudi Arabia and Russia aim to enforce discipline among members and regain market share, contributing to market uncertainty and supply expectations.
Moreover, global trade tensions are compounding the bearish sentiment. New US metal tariffs have disrupted trade, prompting potential reprisals from Canada and renewed urgency in EU negotiations. The higher tariffs and global uncertainty could slow economic growth. A weaker outlook typically reduces oil demand, keeping prices under pressure in the near term.
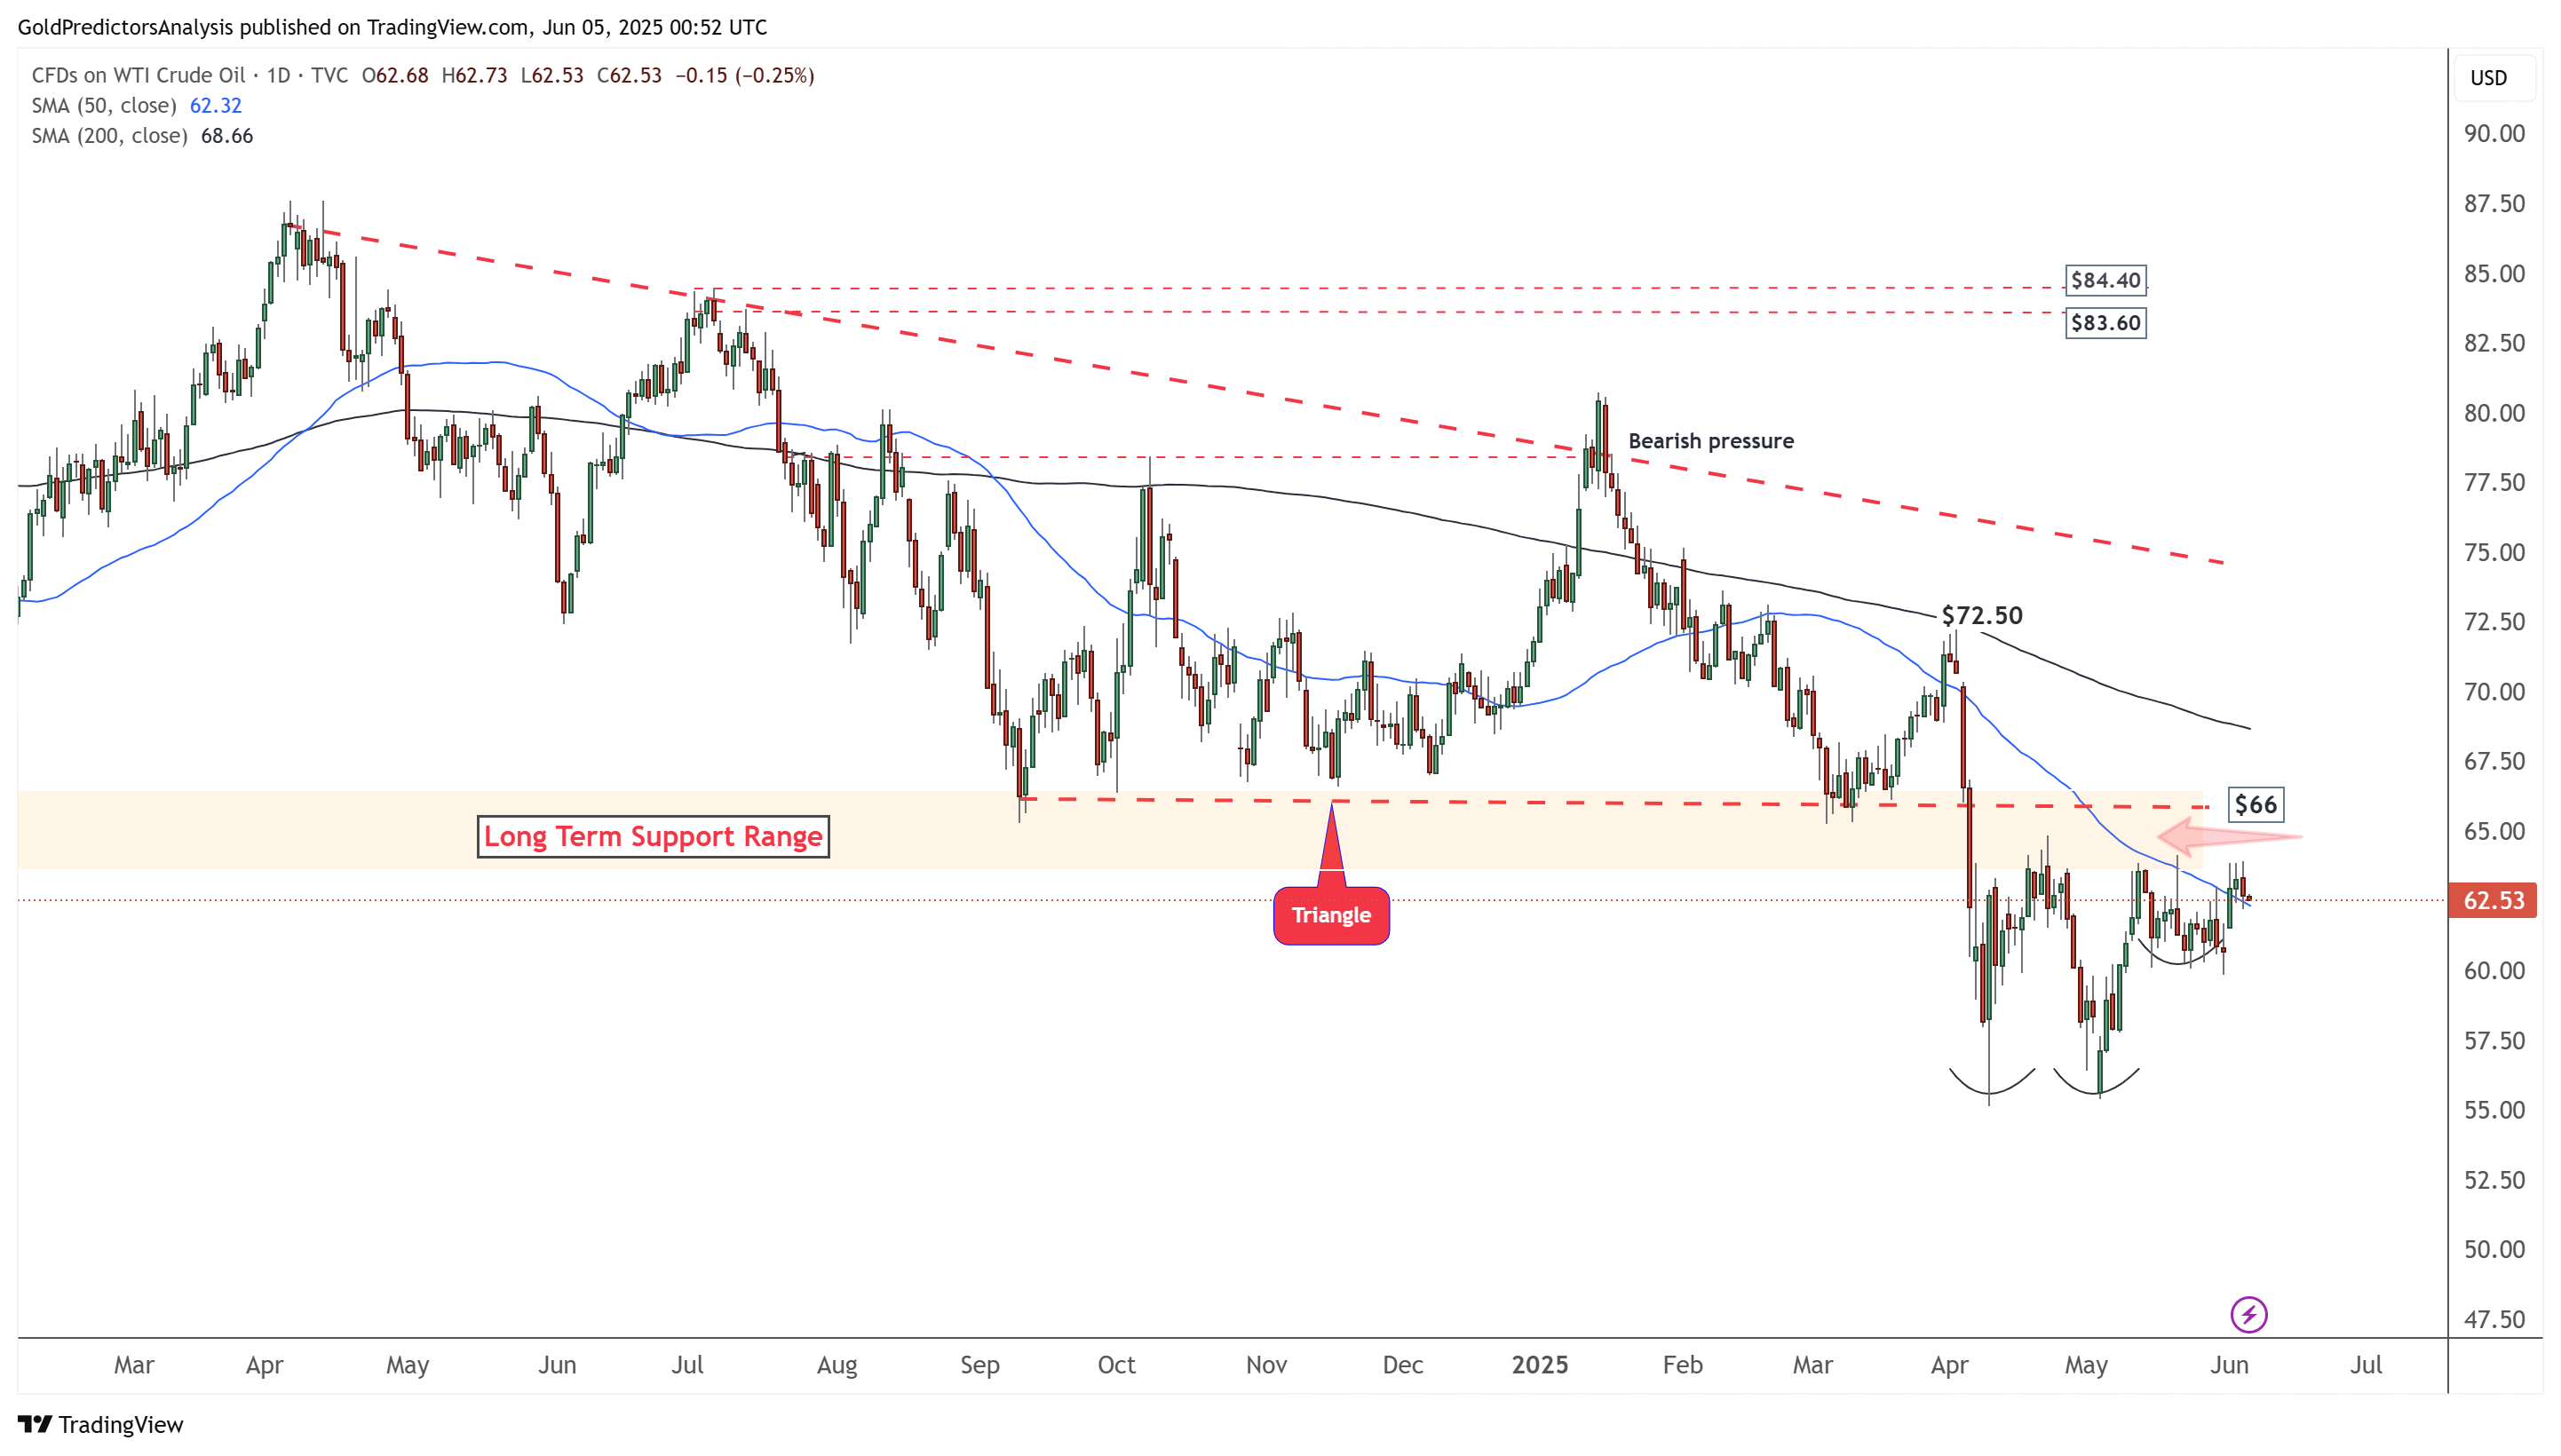
WTI Oil Daily Chart – Consolidation
The daily chart for WTI crude oil shows the price consolidating below the $66 resistance level. Strong consolidation below the 200-day SMA indicates persistent bearish pressure. If the price remains below $66, the downward trend will likely continue. However, a break above the $70 area would signal further upside toward the $75 region.
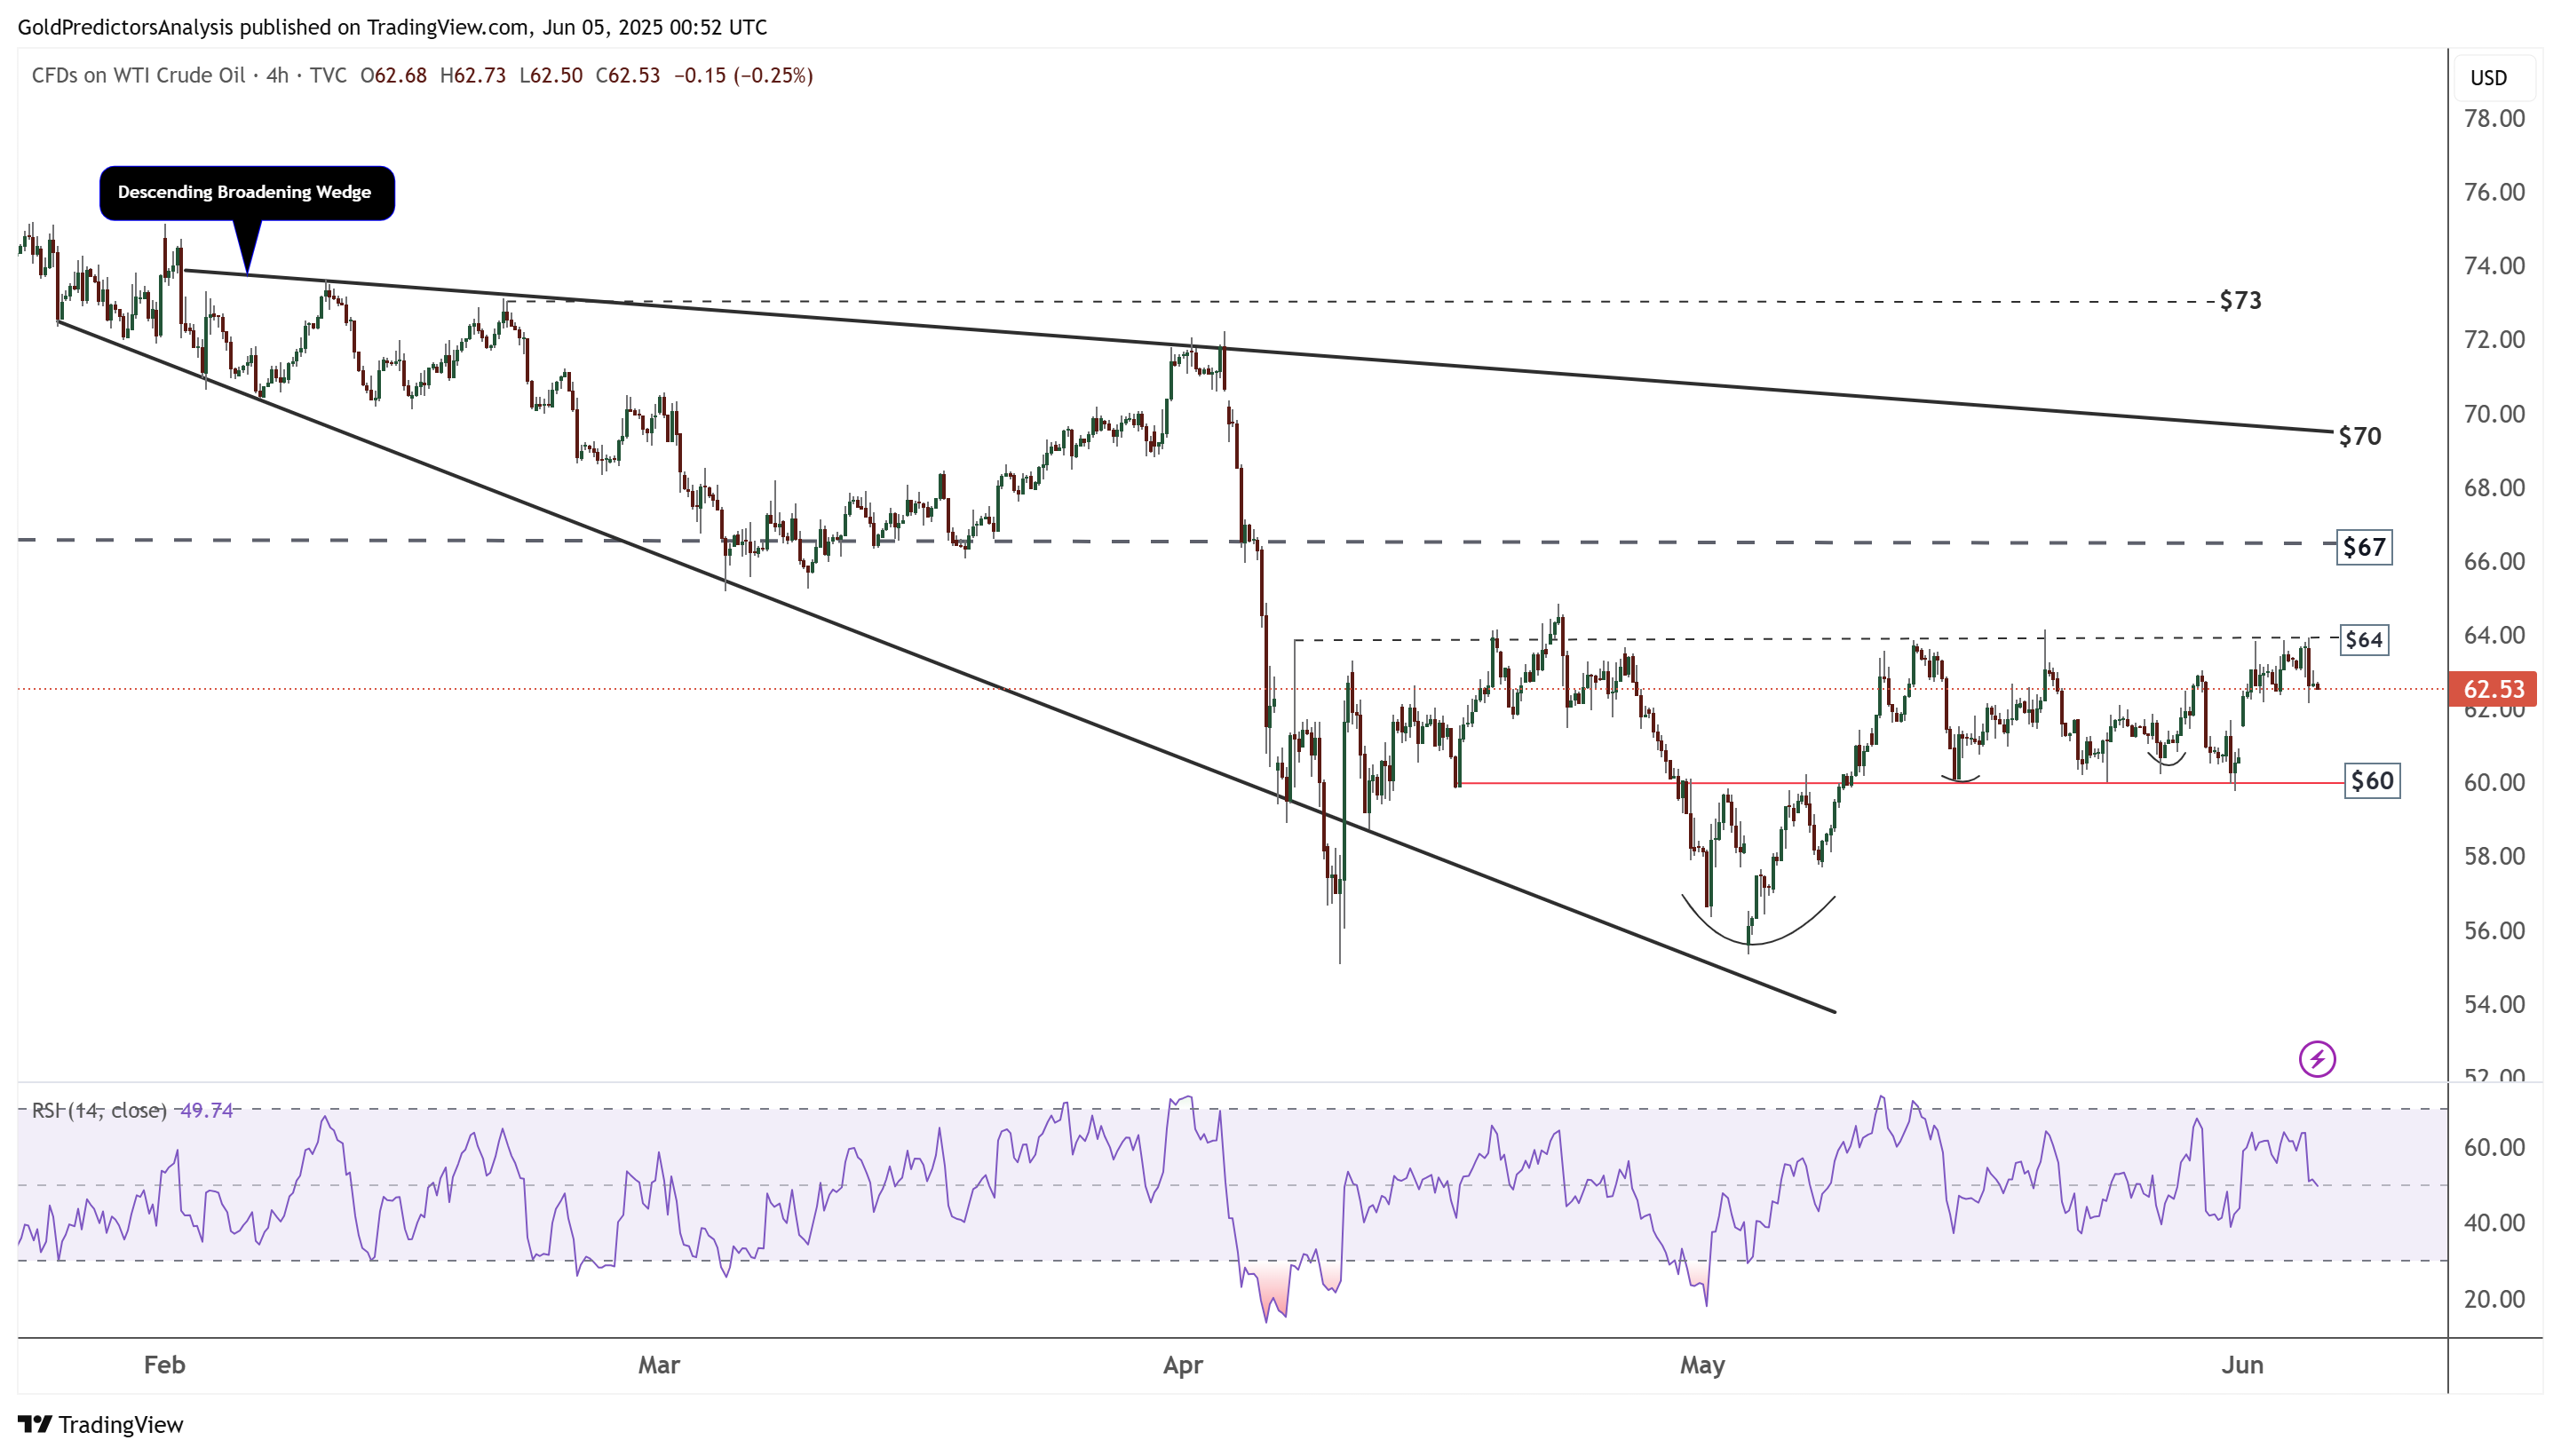
WTI Oil 4-Hour Chart – Descending Broadening Wedge
The 4-hour chart for WTI crude oil shows that the price is consolidating within a descending broadening wedge pattern. Strong consolidation between the $60 and $64 area indicates market uncertainty. A break below $60 would signal further downside, while a break above the $67 area would suggest a move toward $70. A confirmed break above $70 would shift the trend toward a bullish outlook.