 WTI crude oil (CL) prices rose to $62.15 in early Asian trading on Thursday due to supply concerns. The increase followed OPEC+’s decision to keep output levels unchanged, signaling a controlled supply environment. The market also reacted to uncertainty surrounding the upcoming July OPEC+ meeting, which may introduce new output decisions. Additionally, the API report added further bullish sentiment by showing a significant drop of 4.236 million barrels in US crude inventories for the week ending May 23.
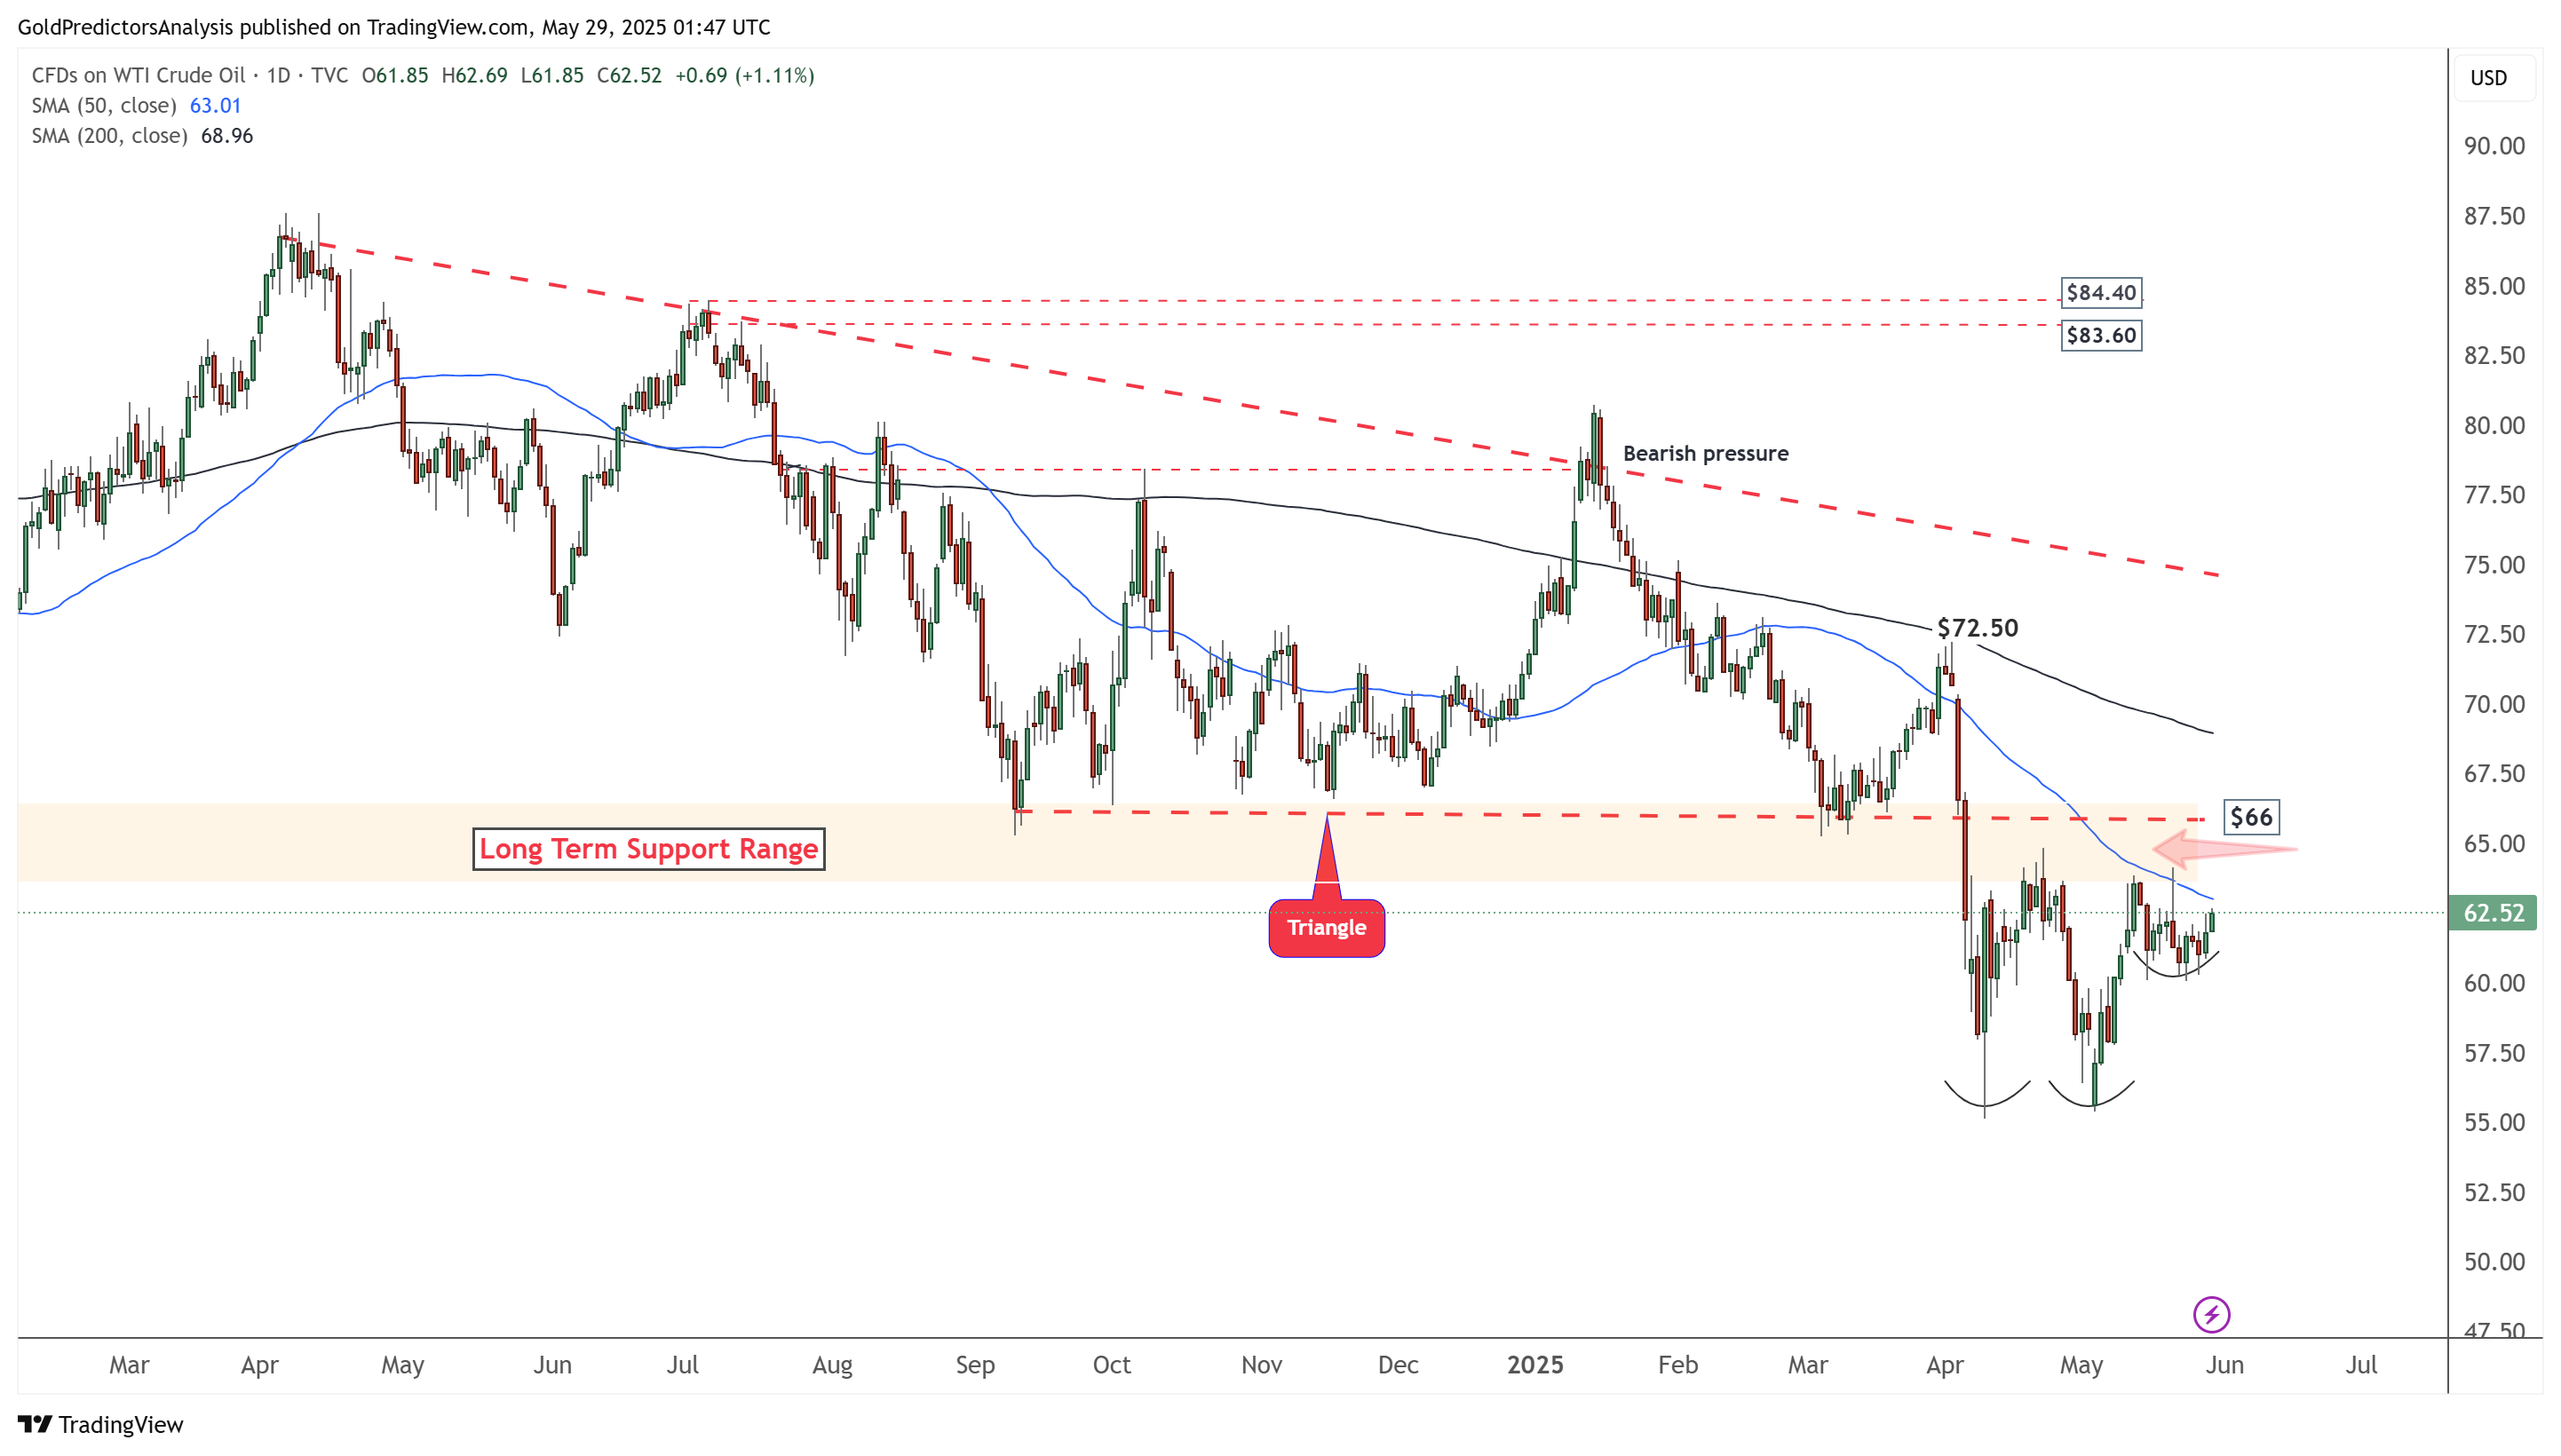
WTI Oil Daily Chart – Positive Development below $66
The daily chart for WTI crude oil shows that the price is forming a strong bottom after consolidating below a long-term pivotal level. However, this bottom will only be confirmed if the price breaks above the $66 range. Despite the strong consolidation, the price remains below the 50-day and 200-day SMAs, indicating a continuing negative trend. A break above the $72 level would confirm the bottom and signal further upside potential.
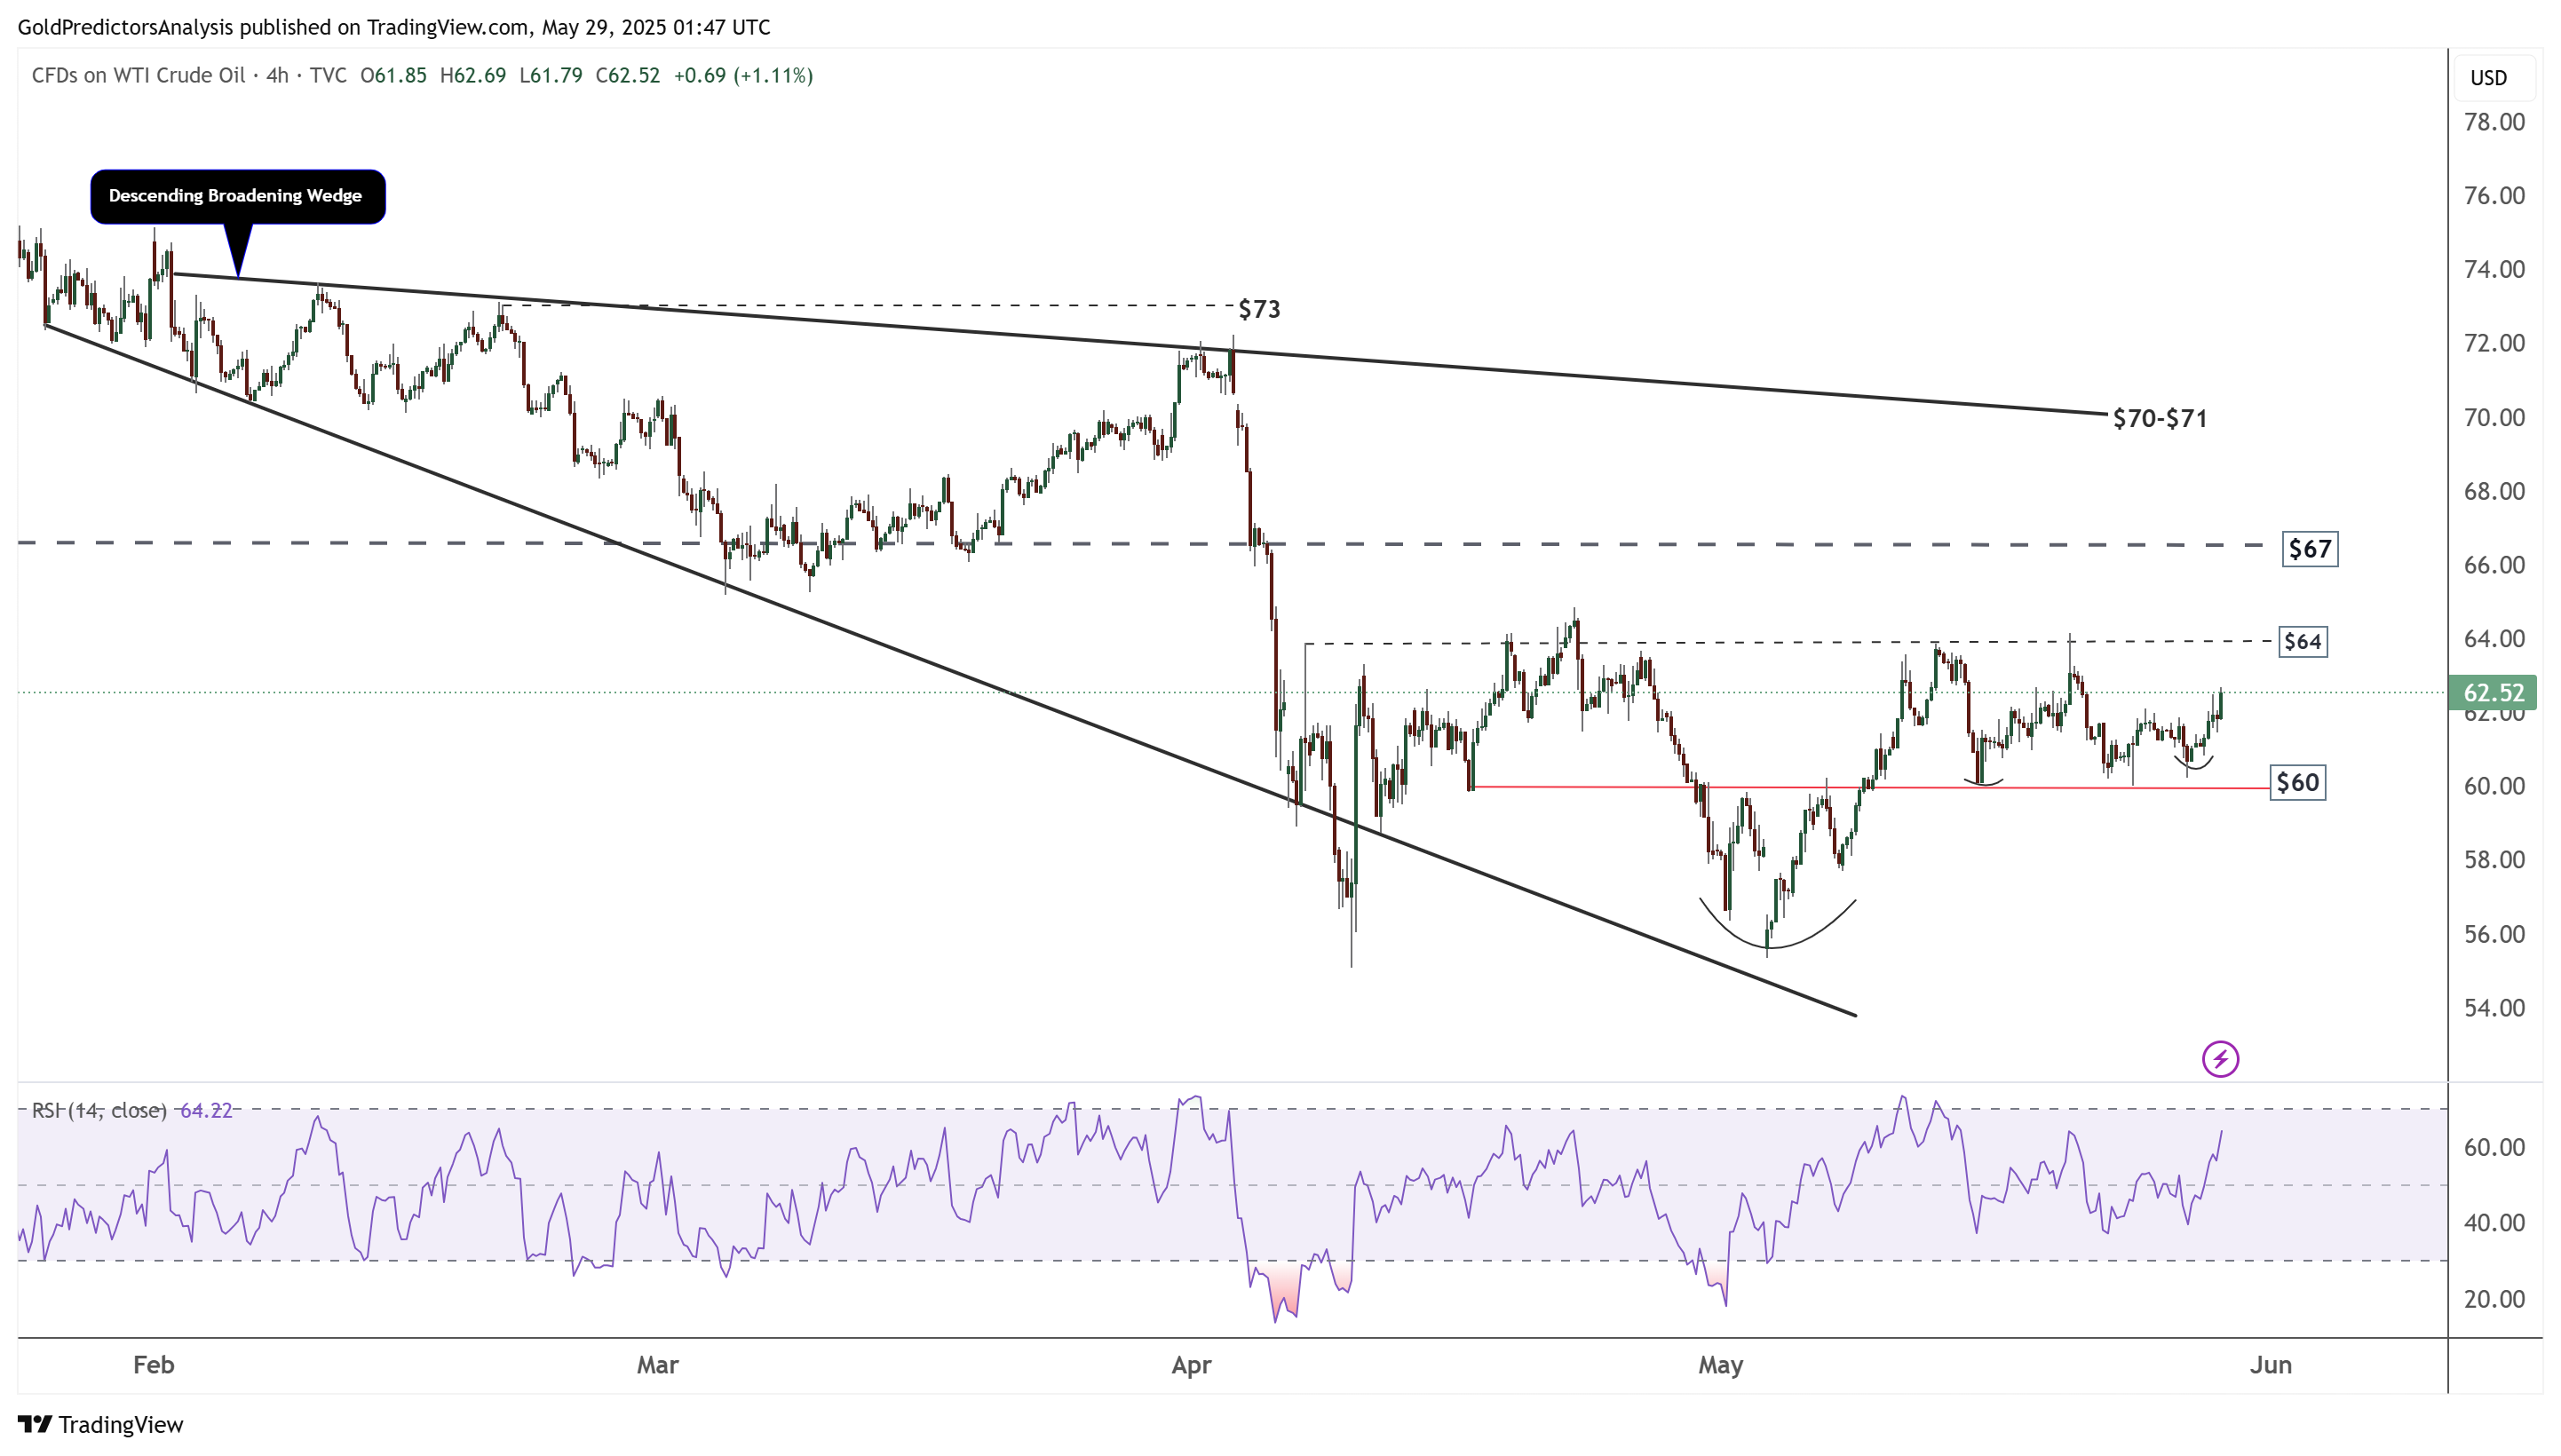
WTI Oil 4-Hour Chart – Descending Broadening Wedge
The 4-hour chart for WTI crude oil shows that the price is consolidating within a descending broadening wedge pattern. This consolidation is taking place within the $60–$64 range, where the price is forming a bullish structure. However, this setup will only be confirmed if the price breaks above the $70 level.