 WTI Oil Daily Chart – Price Rebound
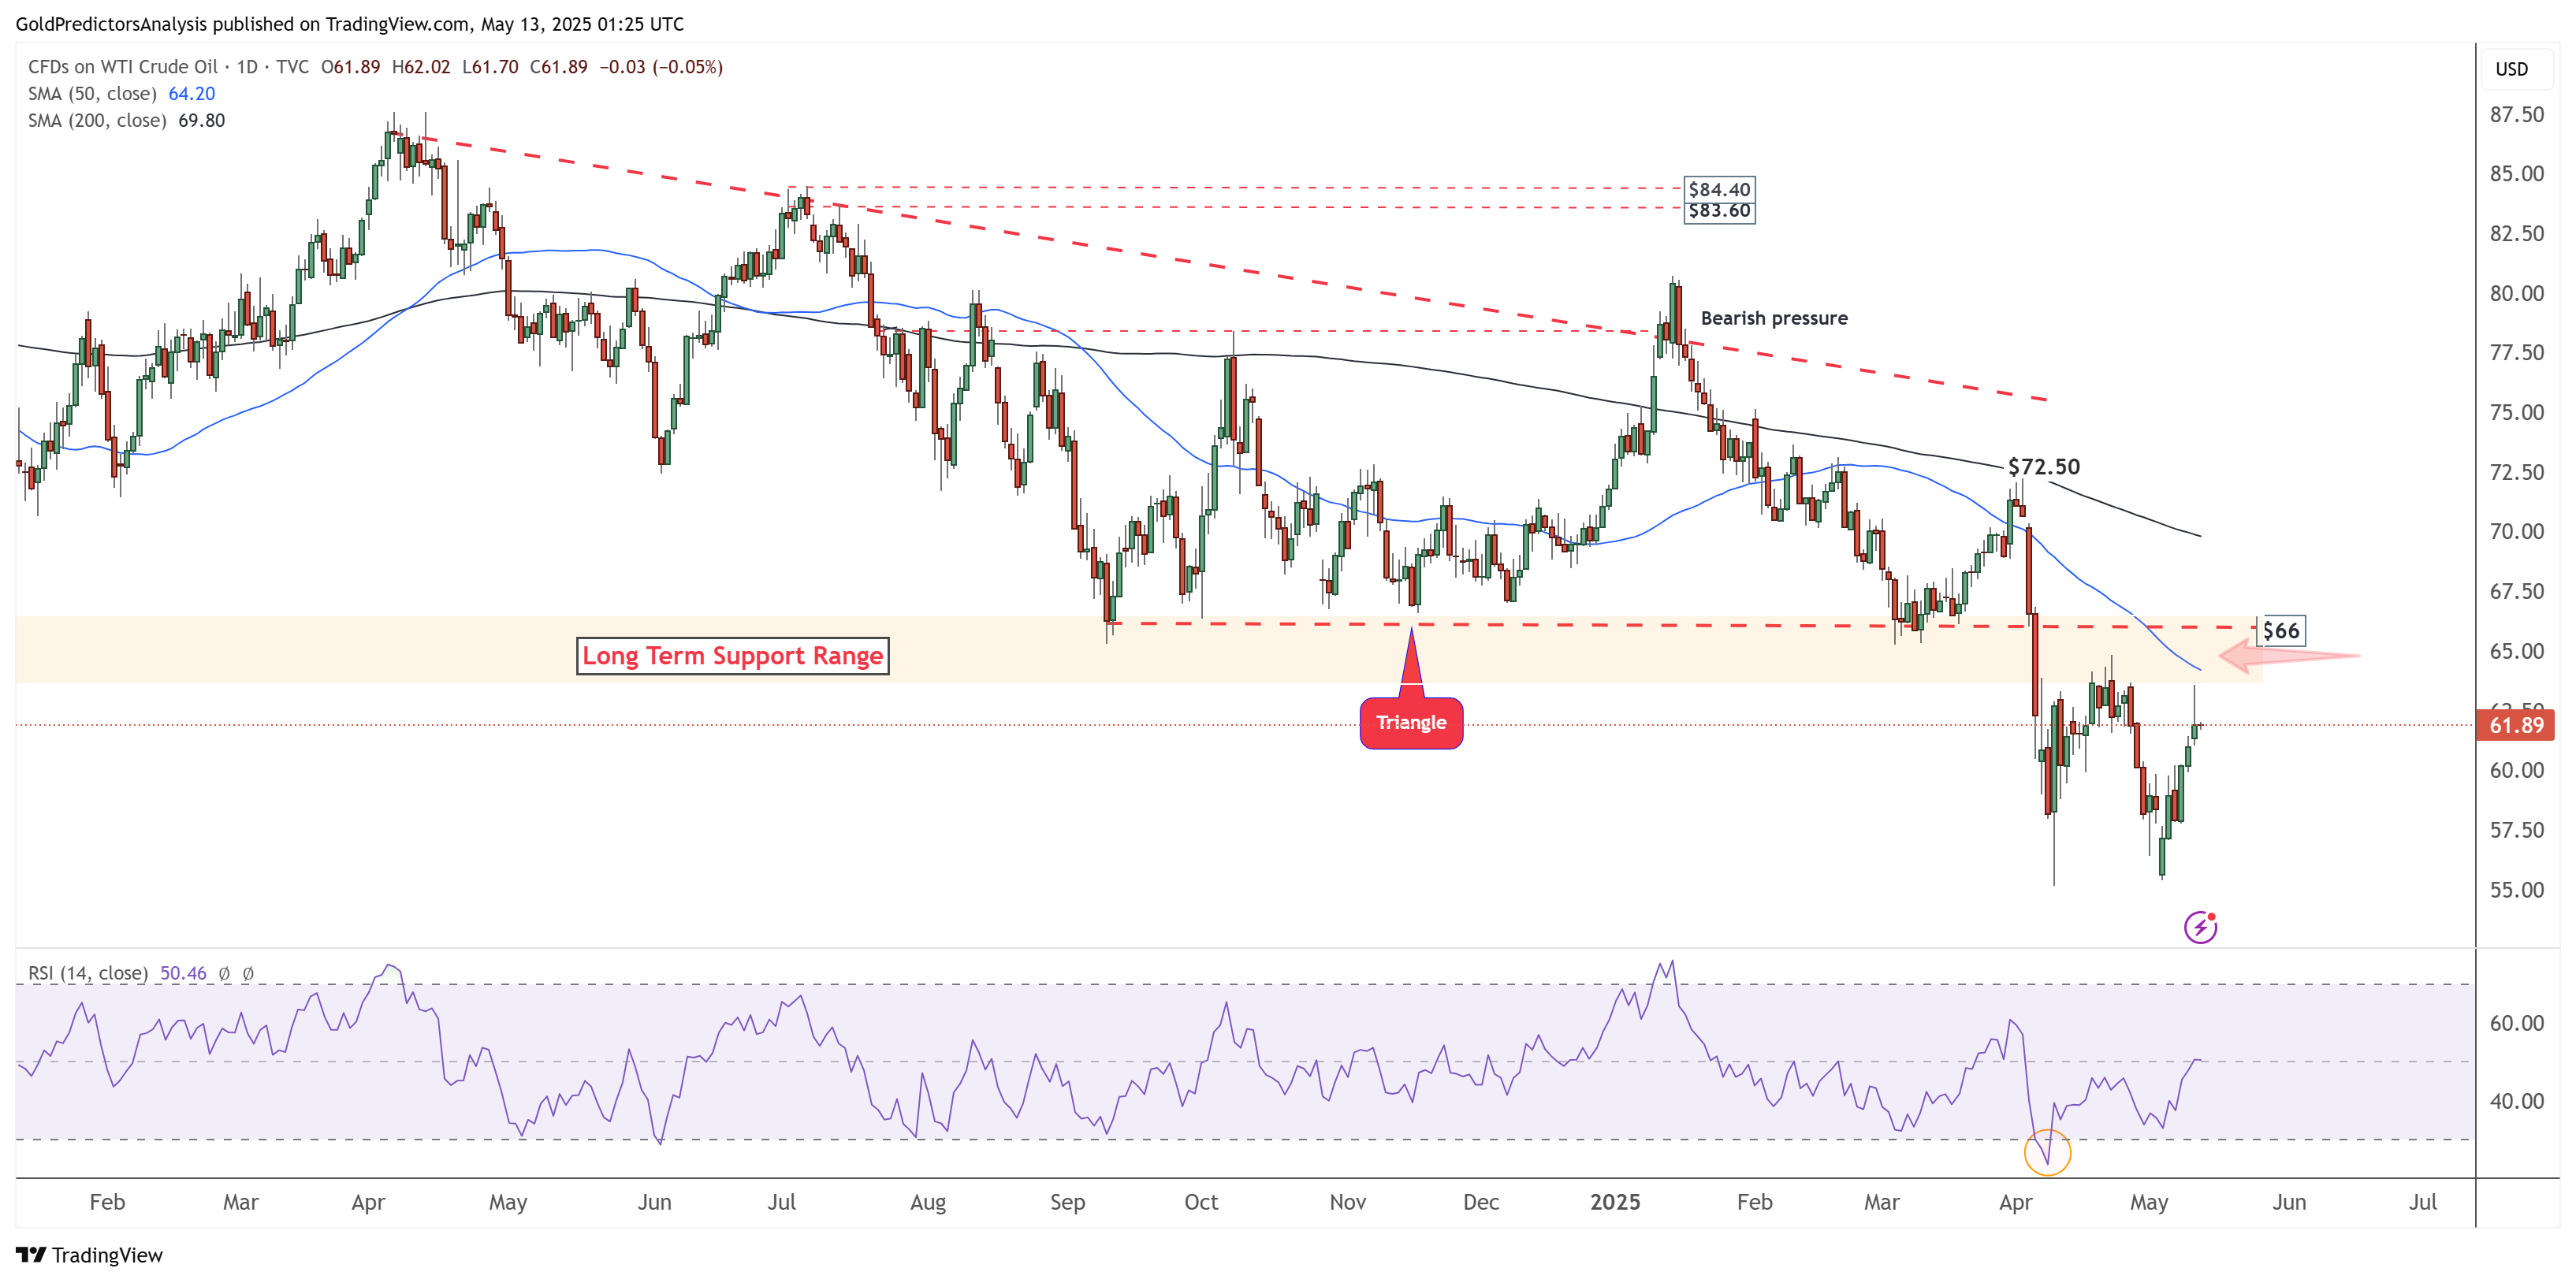
The daily chart for WTI crude oil shows that prices increased following the US-China talks in Geneva and reached strong resistance at $63.50. This resistance is confirmed by the 50-day SMA. Moreover, the lower boundary of the orange zone in the chart also confirms the strong resistance. This orange zone highlights a strong pivotal area, and as long as the price remains below it, WTI remains under bearish pressure. Additionally, the RSI has also reached the mid-level as the price touched the 50-day SMA.
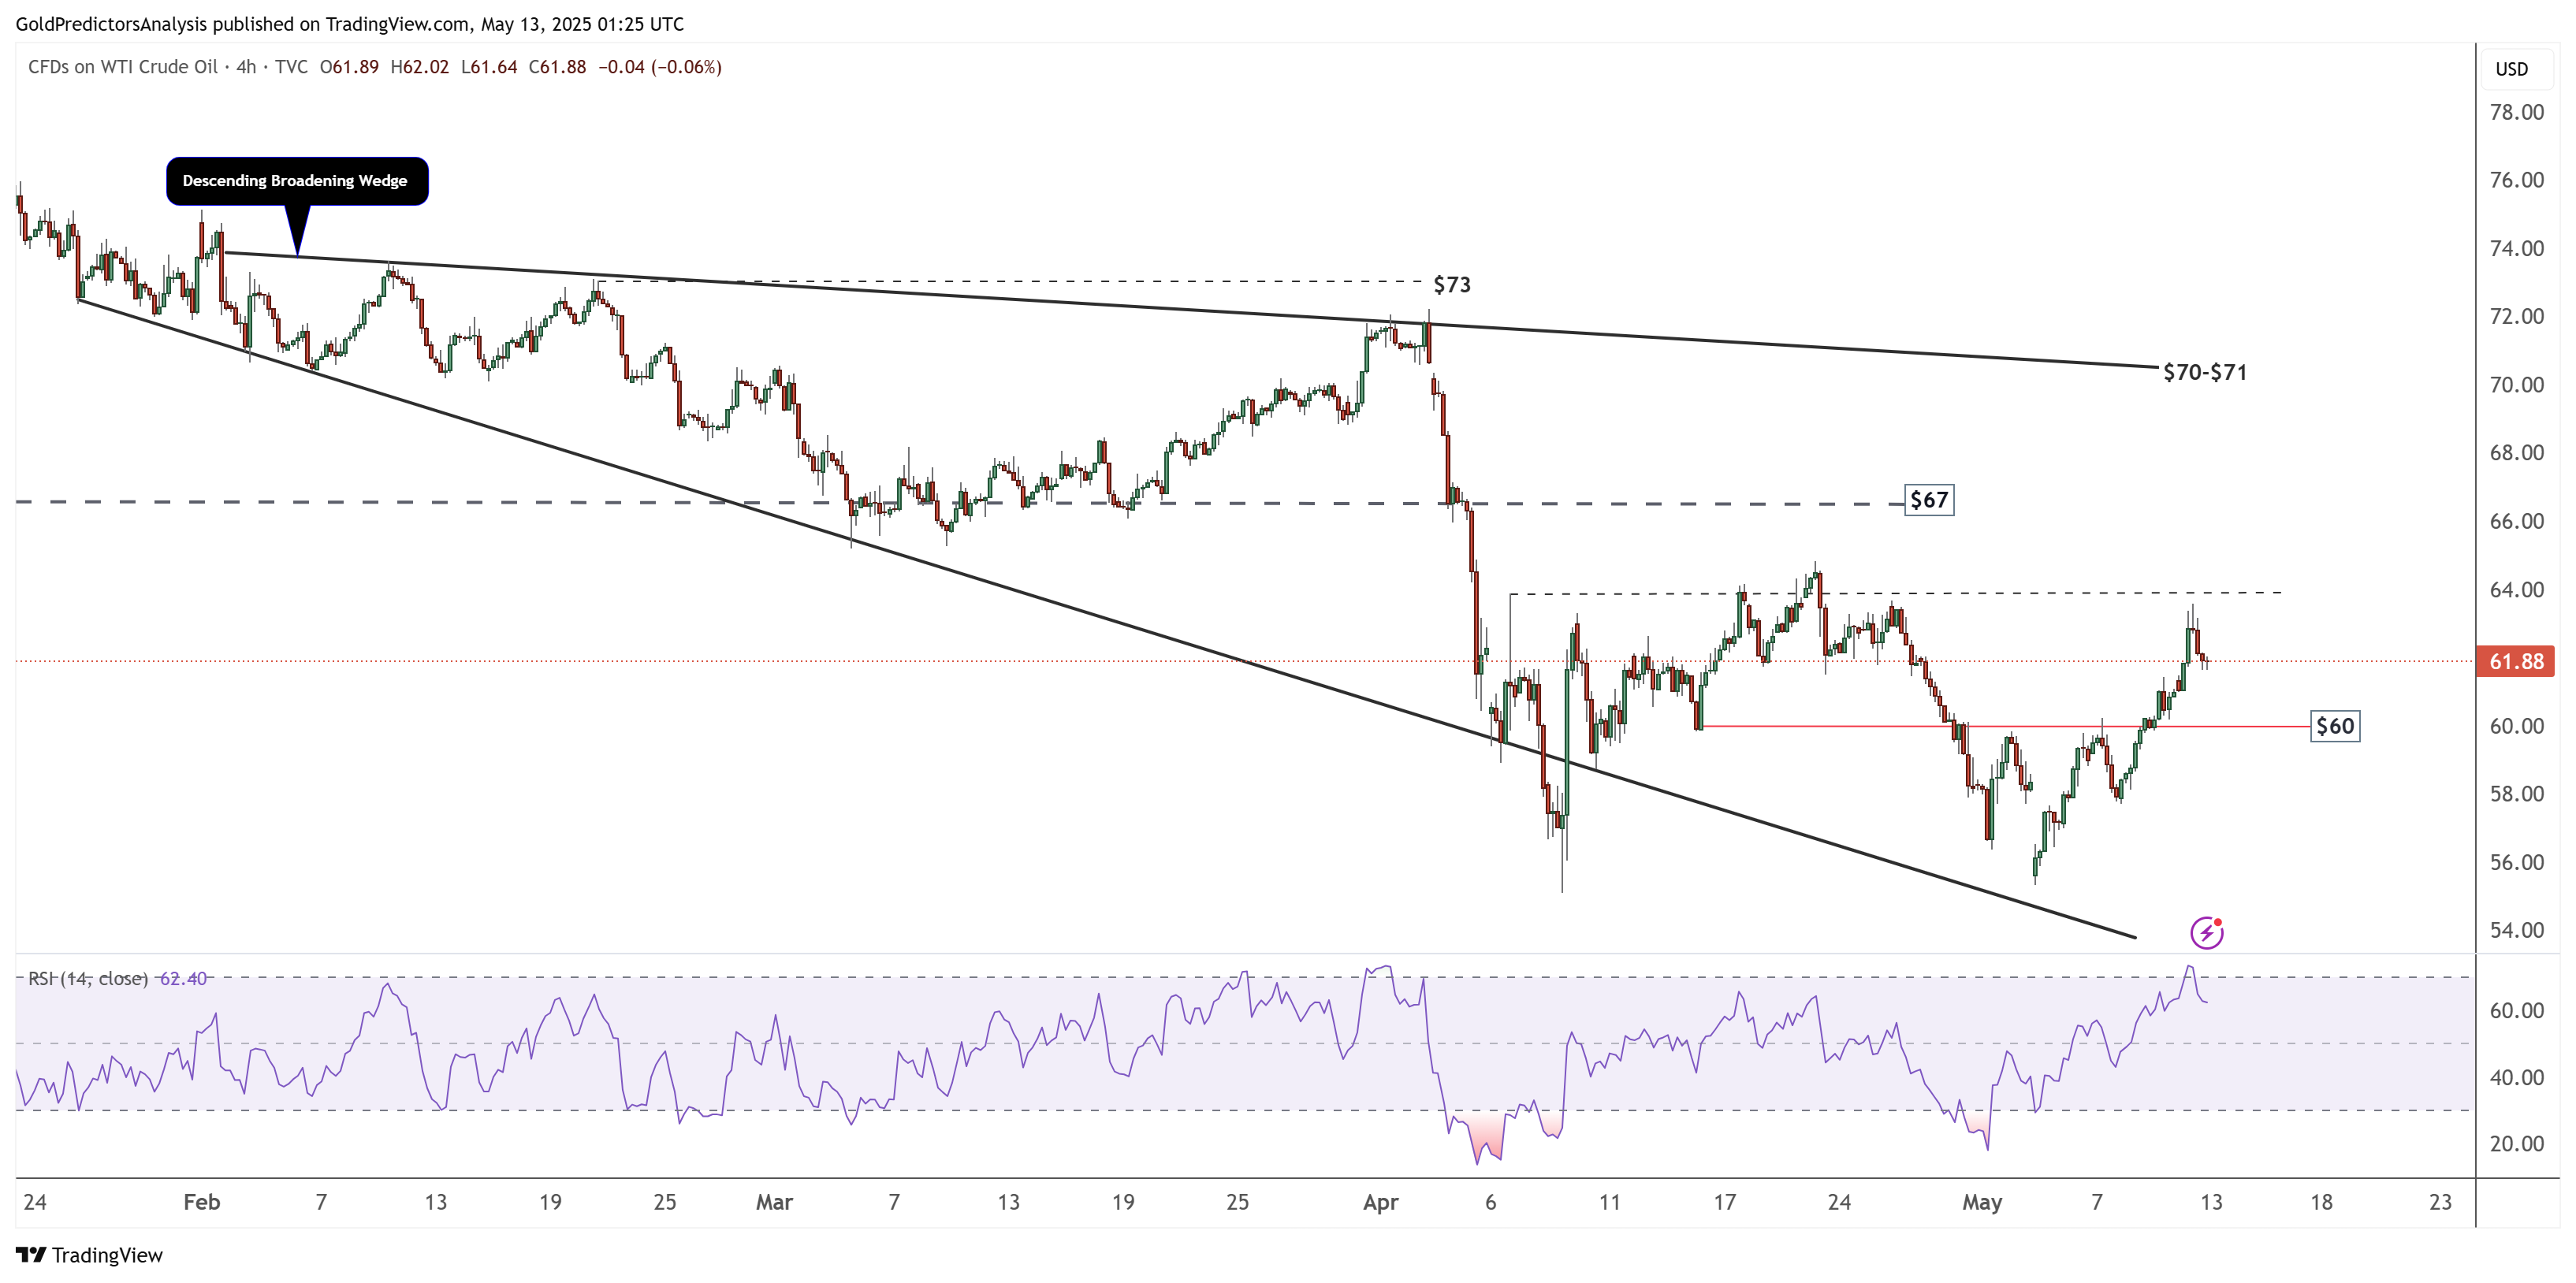
WTI Oil 4-Hour Chart – Price Rebound
The 4-hour chart for WTI crude oil shows that the price remains within the descending broadening wedge pattern and has rebounded from strong support within this structure. The RSI reached the 70 level as the price approached the black dotted line following the rebound. The emergence of the broadening wedge pattern indicates strong volatility, and the price remains bearish as long as it stays below $70.