 WTI crude oil, natural gas, and the US Dollar Index are showing key technical setups, with oil rebounding from long-term support, gas consolidating within a bullish range, and the dollar breaking higher on trade optimism.
Oil prices increased for the fourth straight day as traders reacted to geopolitical tensions and tariff threats. Brent crude oil (BCO) increased to $73.50 per barrel while WTI crude oil (CL) increased to $70.35. Traders expect a tighter supply if secondary tariffs on Russian crude buyers take effect.
Trump intensified pressure on Russia, warning of 100% tariffs on its trade partners if no progress is made on Ukraine within 10–12 days. He also announced a 25% tariff on Indian imports starting Friday. Meanwhile, the US warned China that it could face steep tariffs if it continues its purchases from Russia. In addition, new sanctions targeted over 115 Iran-linked entities, as China remains a major buyer of Iranian oil. These actions have heightened concerns over a tighter global oil supply.
Despite rising prices, US crude inventories rose by 7.7 million barrels. This increment was highest in the six months.
On the other hand, gasoline stocks fell sharply by 2.7 million barrels to 228.4 million, far surpassing the expected 600,000-barrel draw. The large crude build added pressure, but strong gasoline demand balanced the outlook, creating a neutral impact on the oil market in the near term.
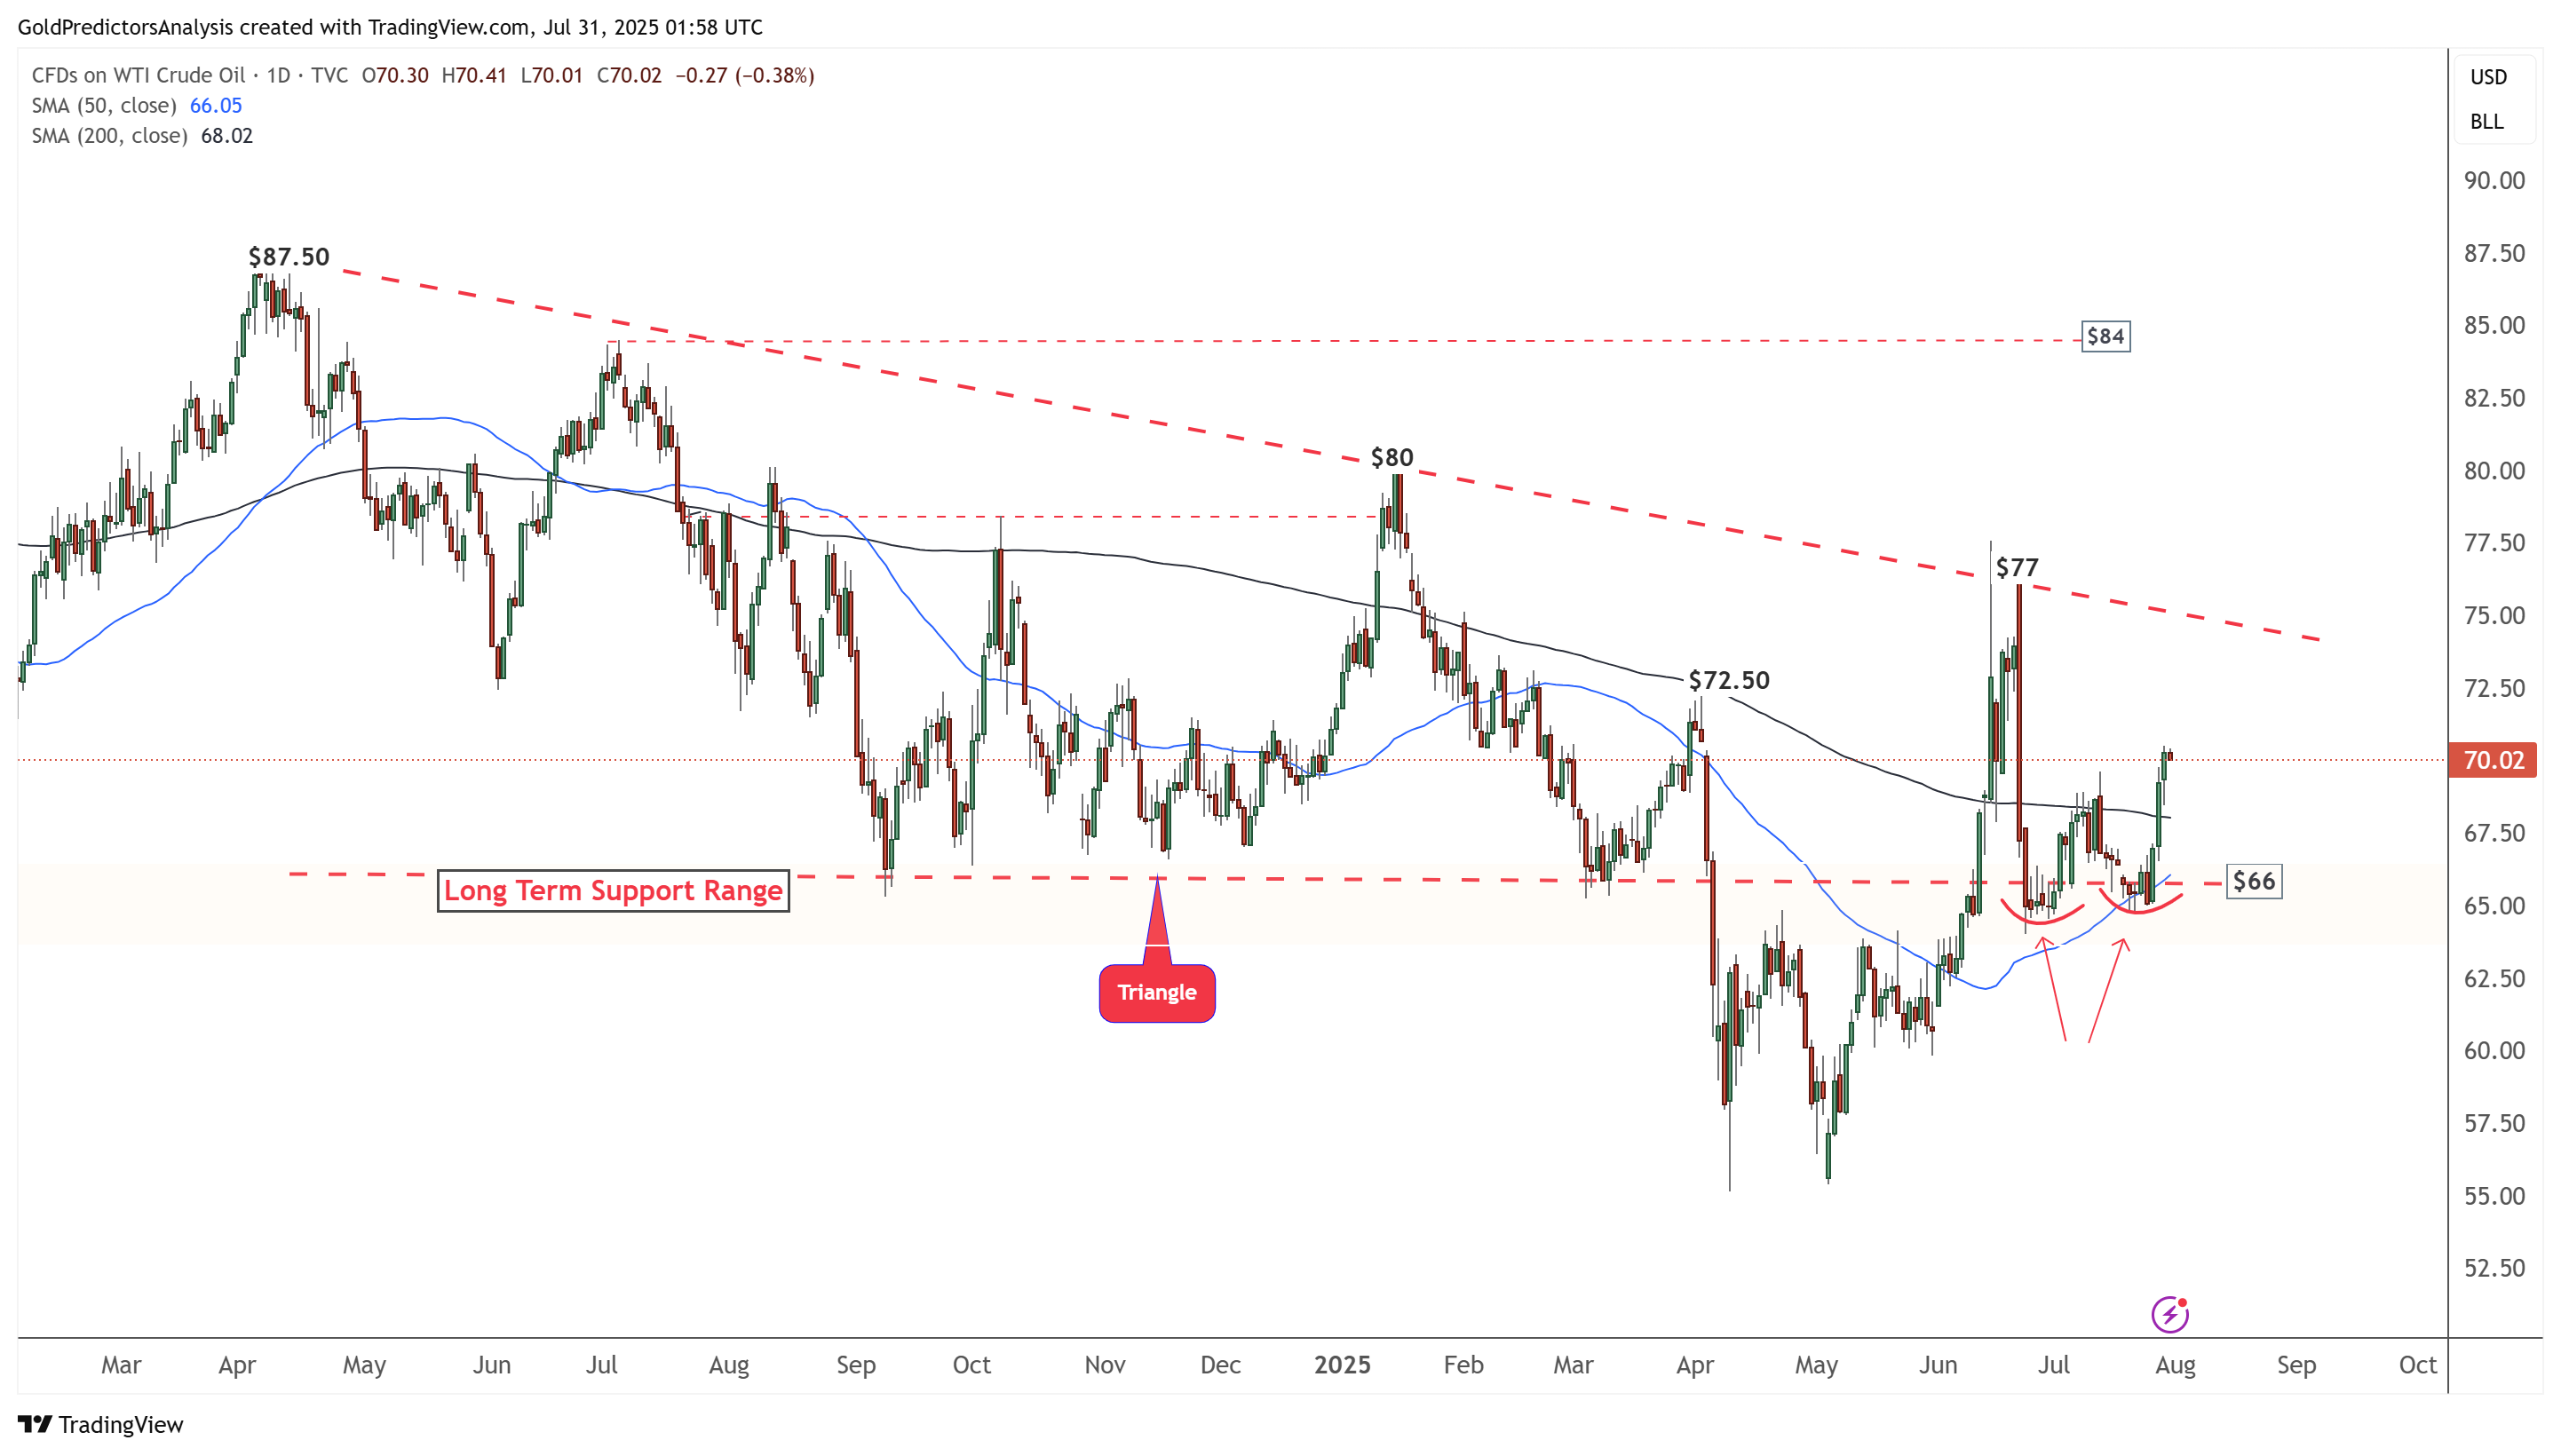
WTI Oil Daily Chart – Double Bottom Pattern
The daily chart for WTI crude oil shows that the price has formed a double bottom at the long-term support near the $64 region and has initiated a strong rebound. The price has broken above the 200-day SMA and is showing potential for further upside. Strong resistance lies near the $75 area, and a breakout above this level could trigger a rally toward the $80 region.
Despite this rally, the 50-day SMA remains below the 200-day SMA. However, if WTI crude oil breaks above the $75 resistance, the 50-day SMA may start to recover and cross above the 200-day SMA, signalling a stronger bullish trend.
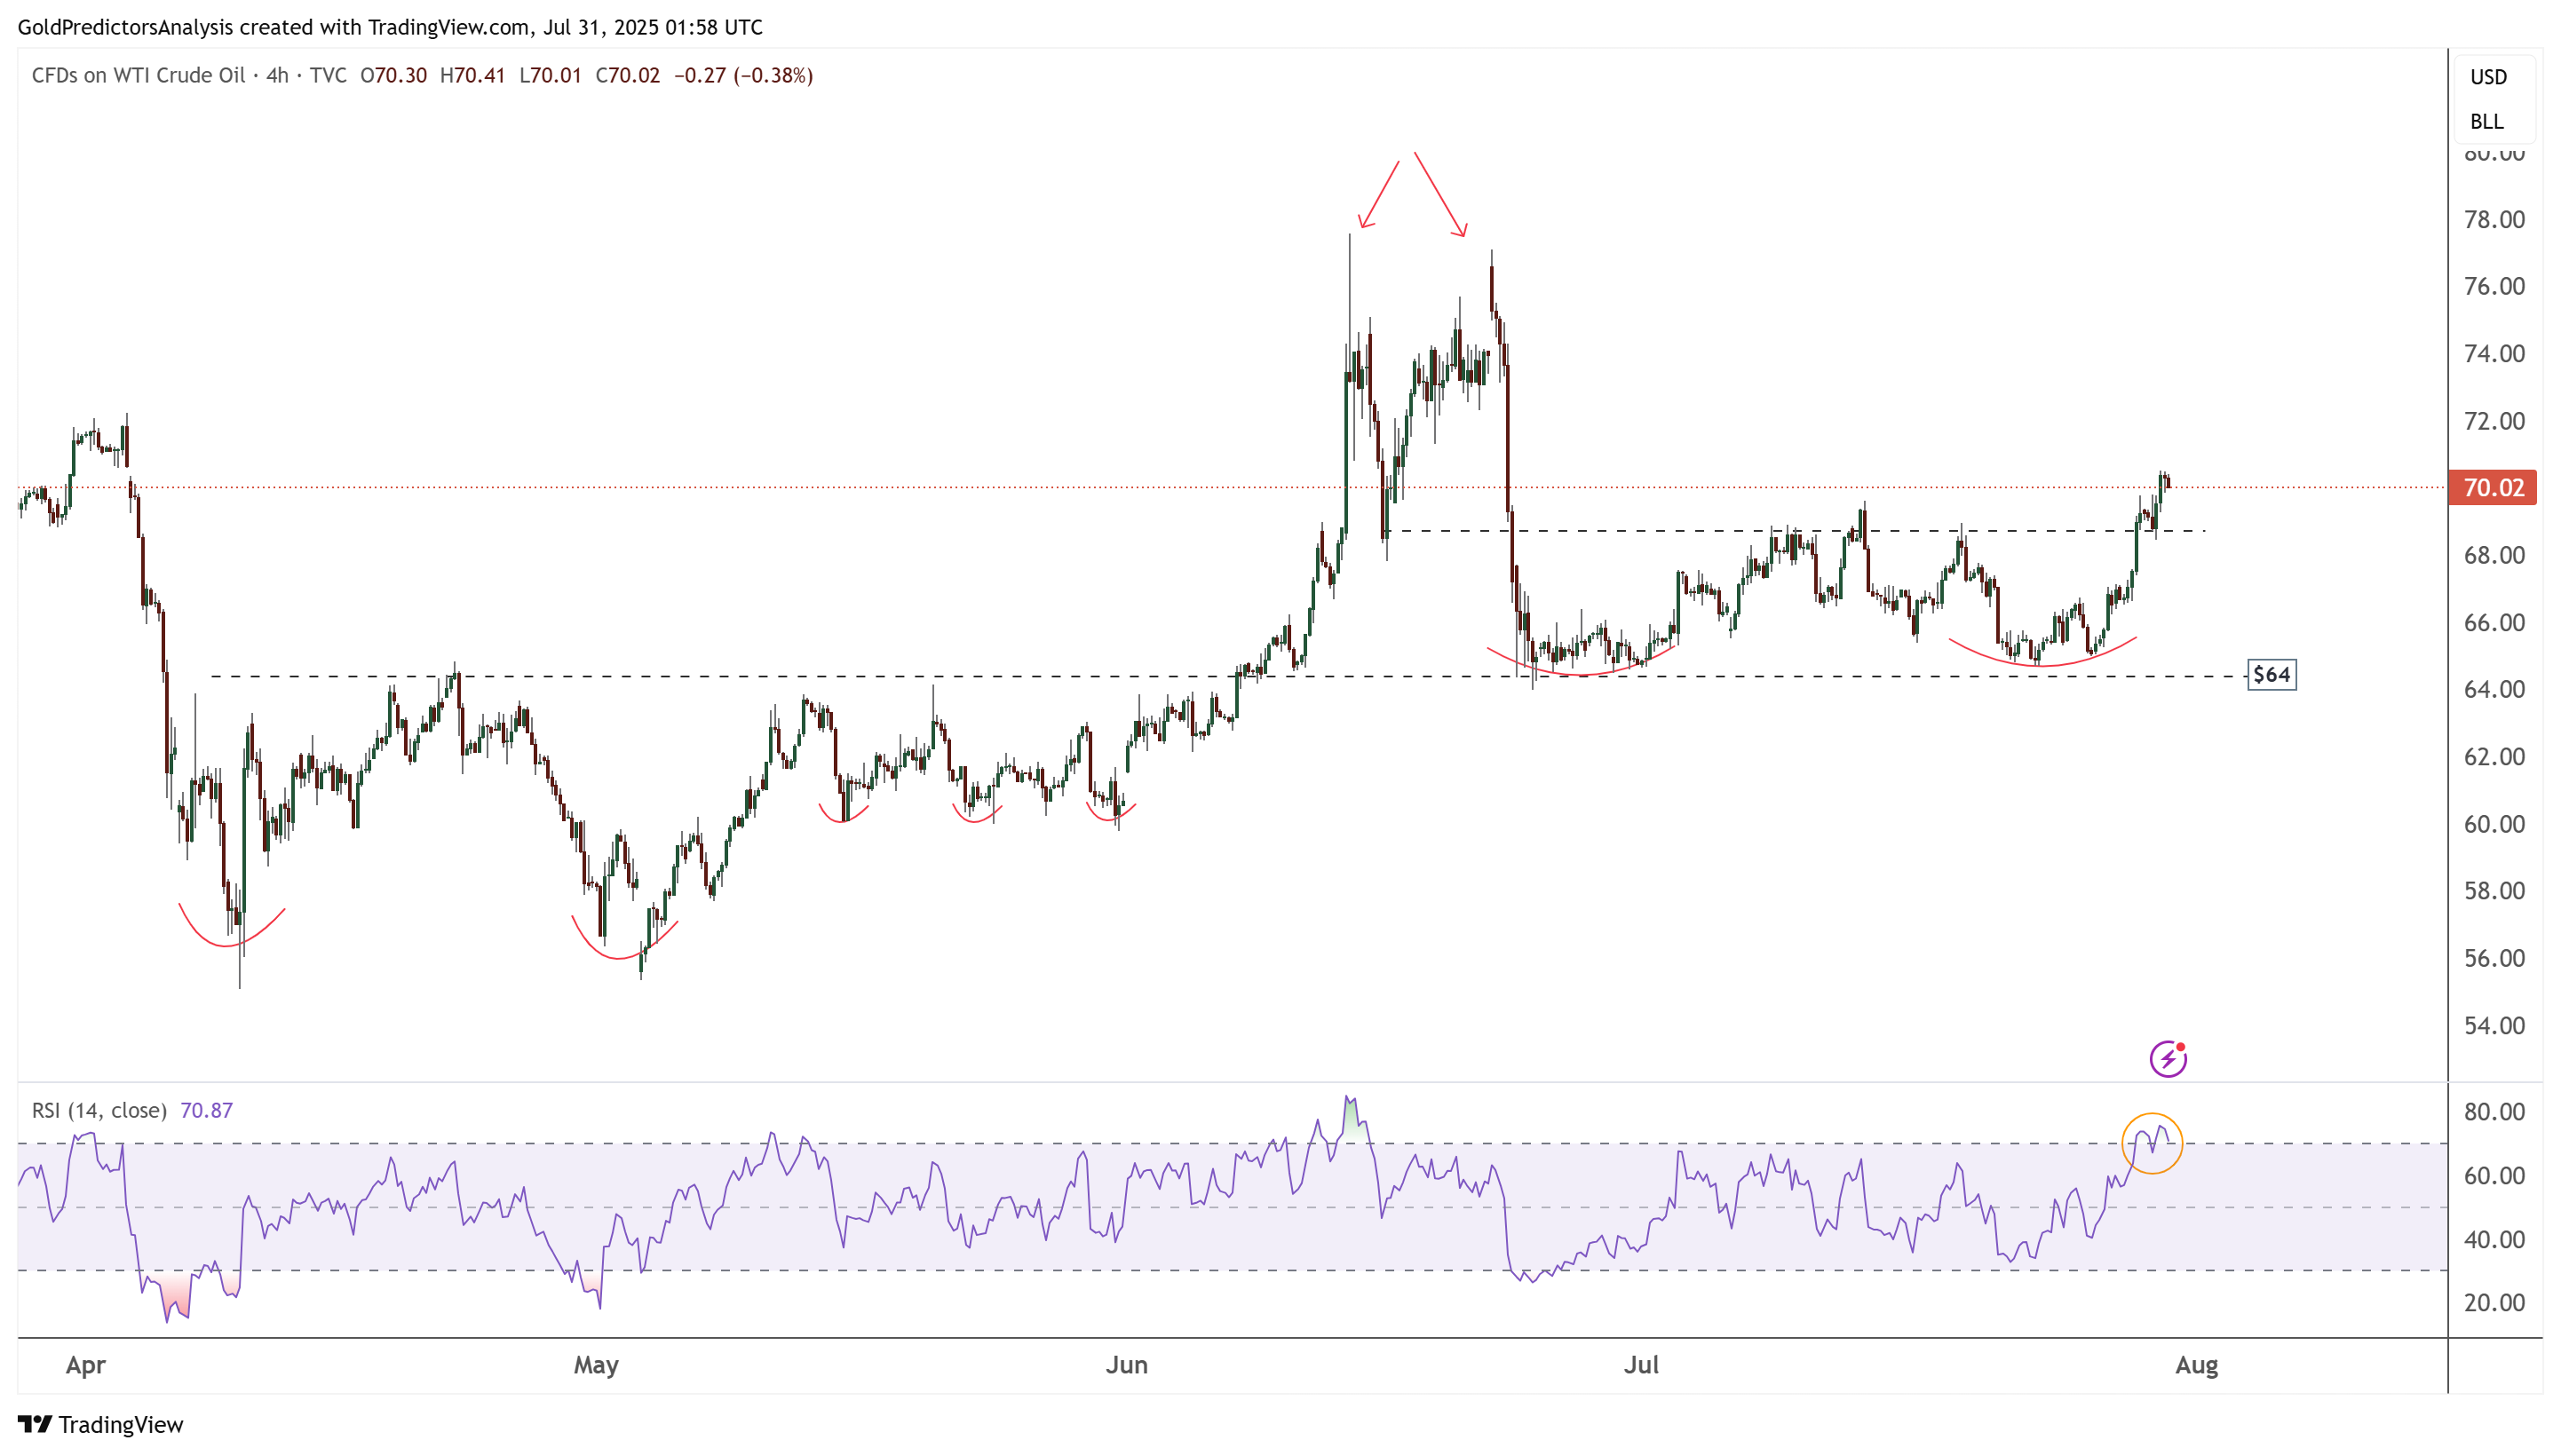
WTI Oil 4-Hour Chart – Bullish Development
The 4-hour chart for WTI crude oil shows that prices have formed a double bottom near the $64 area and have broken above the $69 region. Additionally, the formation of a strong bottom pattern around the $55 level suggests that WTI prices may continue to rally.
For the rally to gain momentum, prices must break above the key resistance at $75, which would likely trigger strong bullish momentum. However, the RSI indicates short-term overbought conditions, so any pullback in WTI crude oil is likely to be viewed as a temporary correction within a broader rebound.