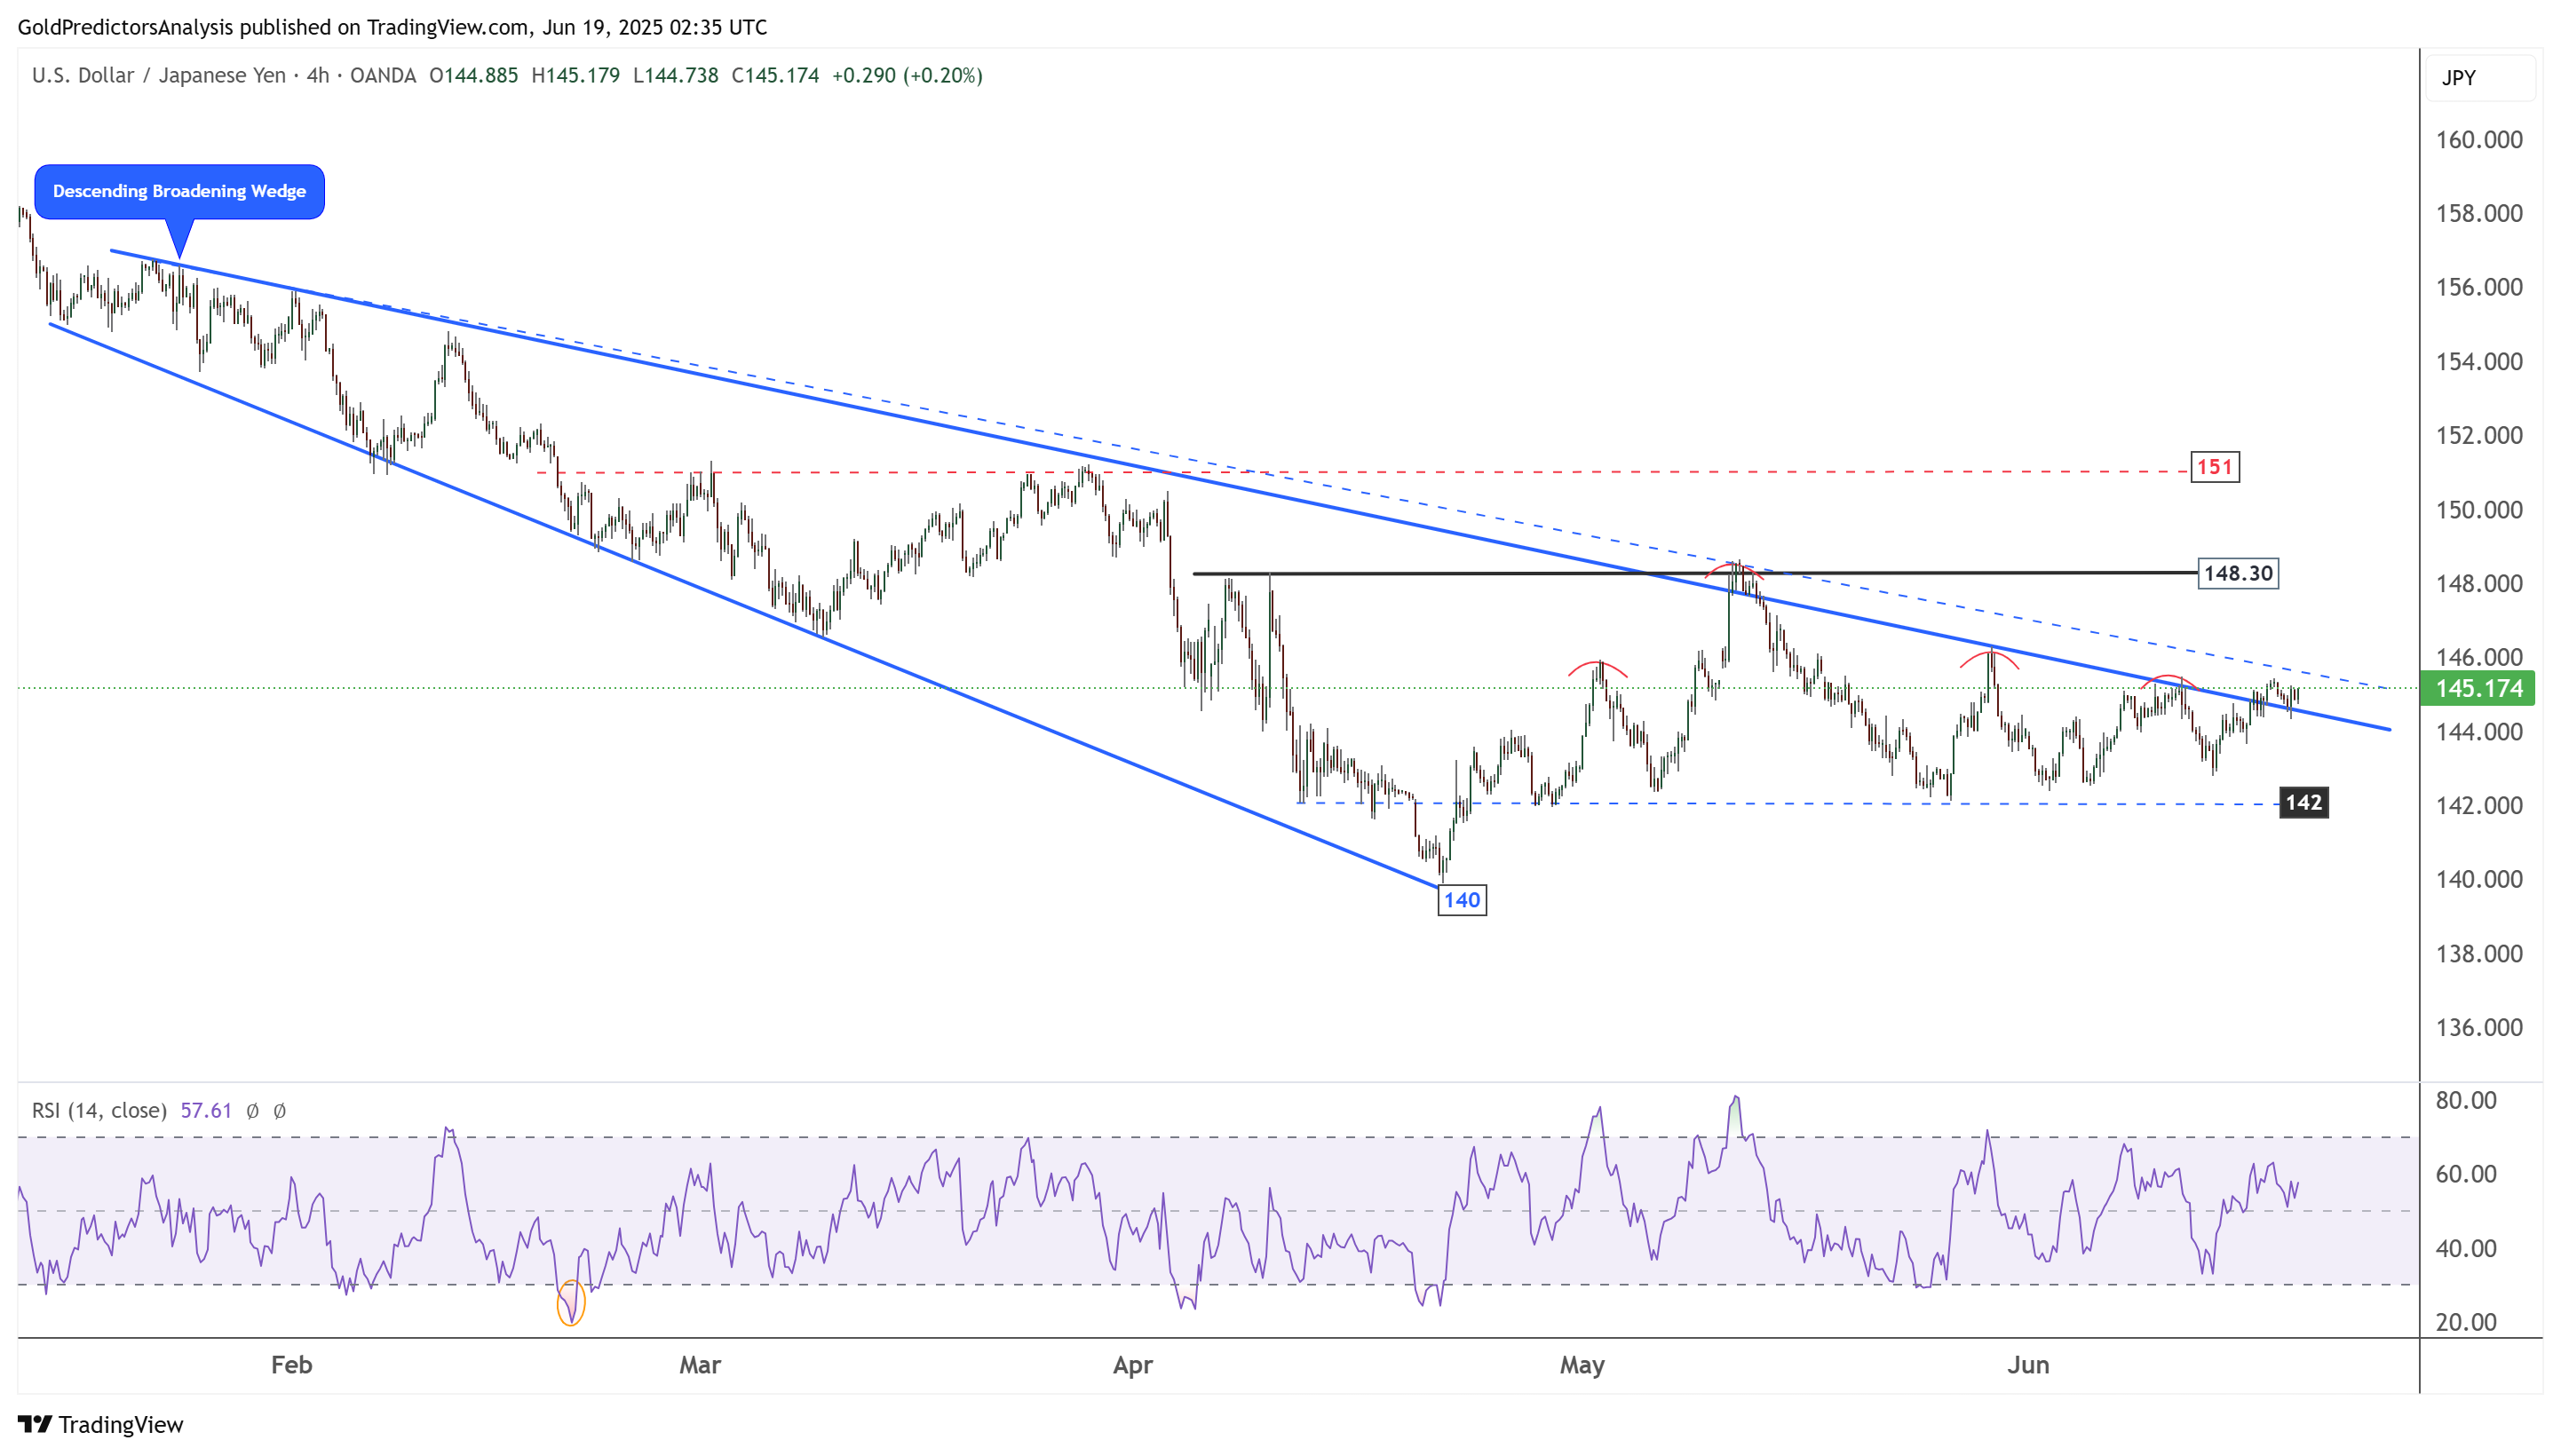
 The 4-hour chart for USD/JPY shows that the pair is trading within a descending broadening wedge pattern and is approaching the resistance of this formation.
A break above 148.30 is required to confirm further upside. Until this breakout occurs, the pair remains in tight consolidation. A break below 142.00 would indicate further downside within the current range.
The US Dollar weakened against the Japanese Yen after the Federal Reserve held interest rates steady and signalled two rate cuts this year. The decision aligned with expectations but triggered a dovish market reaction. The 2-year Treasury yield dropped nearly 5 basis points to 3.9%.
The pair hits the 144.50 but recovers and trades above 145 as the US dollar rebounds from the 98 support region.
The Fed’s statement removed prior warnings about inflation and labour market risks. Policymakers now describe the labour market as “solid,” with a projected unemployment rate of 4.5% by year-end.
Markets focused on the dot plot, which still shows two expected cuts by the end of 2025. Seven FOMC members support this view, while four members expect one cut. The Fed’s cautious tone further supported risk-off sentiment.