


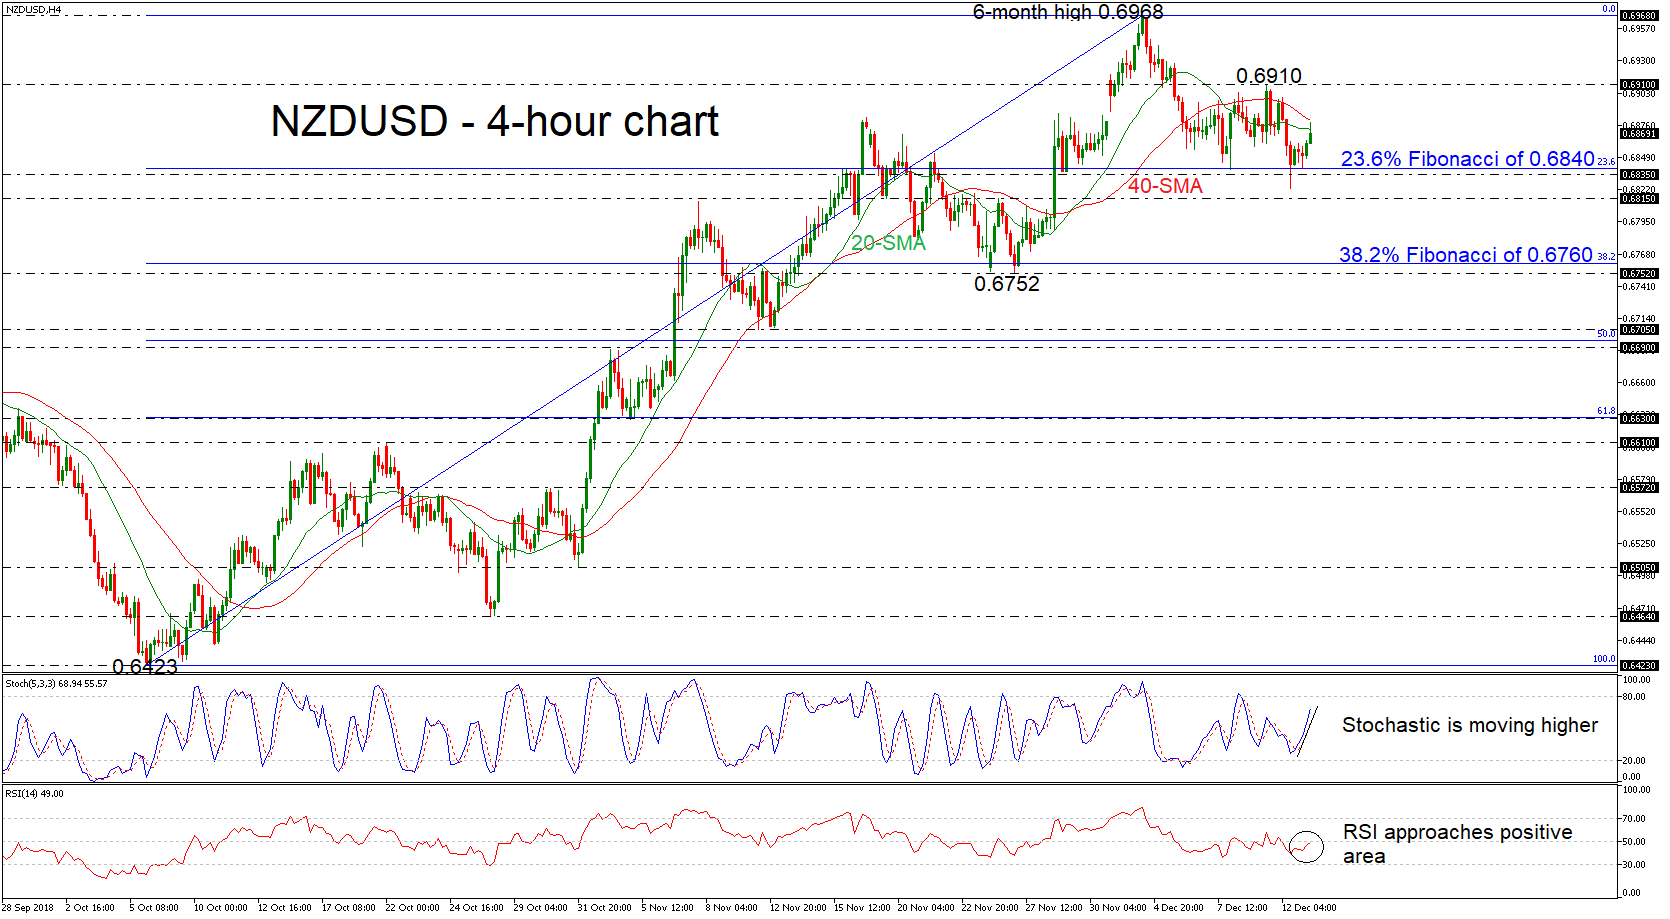
 NZDUSD has reversed back up again following the pullback on the 23.6% Fibonacci retracement level of the upleg from 0.6423 to 0.6968, around the 0.6835 support level. Currently, the price is testing the 20-day simple moving average (SMA) near 0.6873, which is acting as strong resistance level for the bulls. The stochastic oscillator is approaching the overbought level, while the RSI is trying to jump above the 50 level.
If the bulls continue to have control, the price could touch the 0.6910 resistance barrier, identified by the latest highs in the 4-hour chart. A potential upside violation of this region could open the way towards the six-month high of 0.6968. More upside pressures could send prices until the psychological figure of 0.7000, however, there is no significant resistance near this barrier.
In case of declines in the pair, an immediate support area may come from the 0.6815 – 0.6835 region, which stands near the 23.6% Fibonacci. If the sellers manage to push below that hurdle, that would mark a drop towards the 38.2% Fibonacci mark of 0.6760.
Overall, the short-term outlook appears bullish as the price has been creating an upward rally over the last couple of months after bottoming at 0.6423.
Origin: XM


