


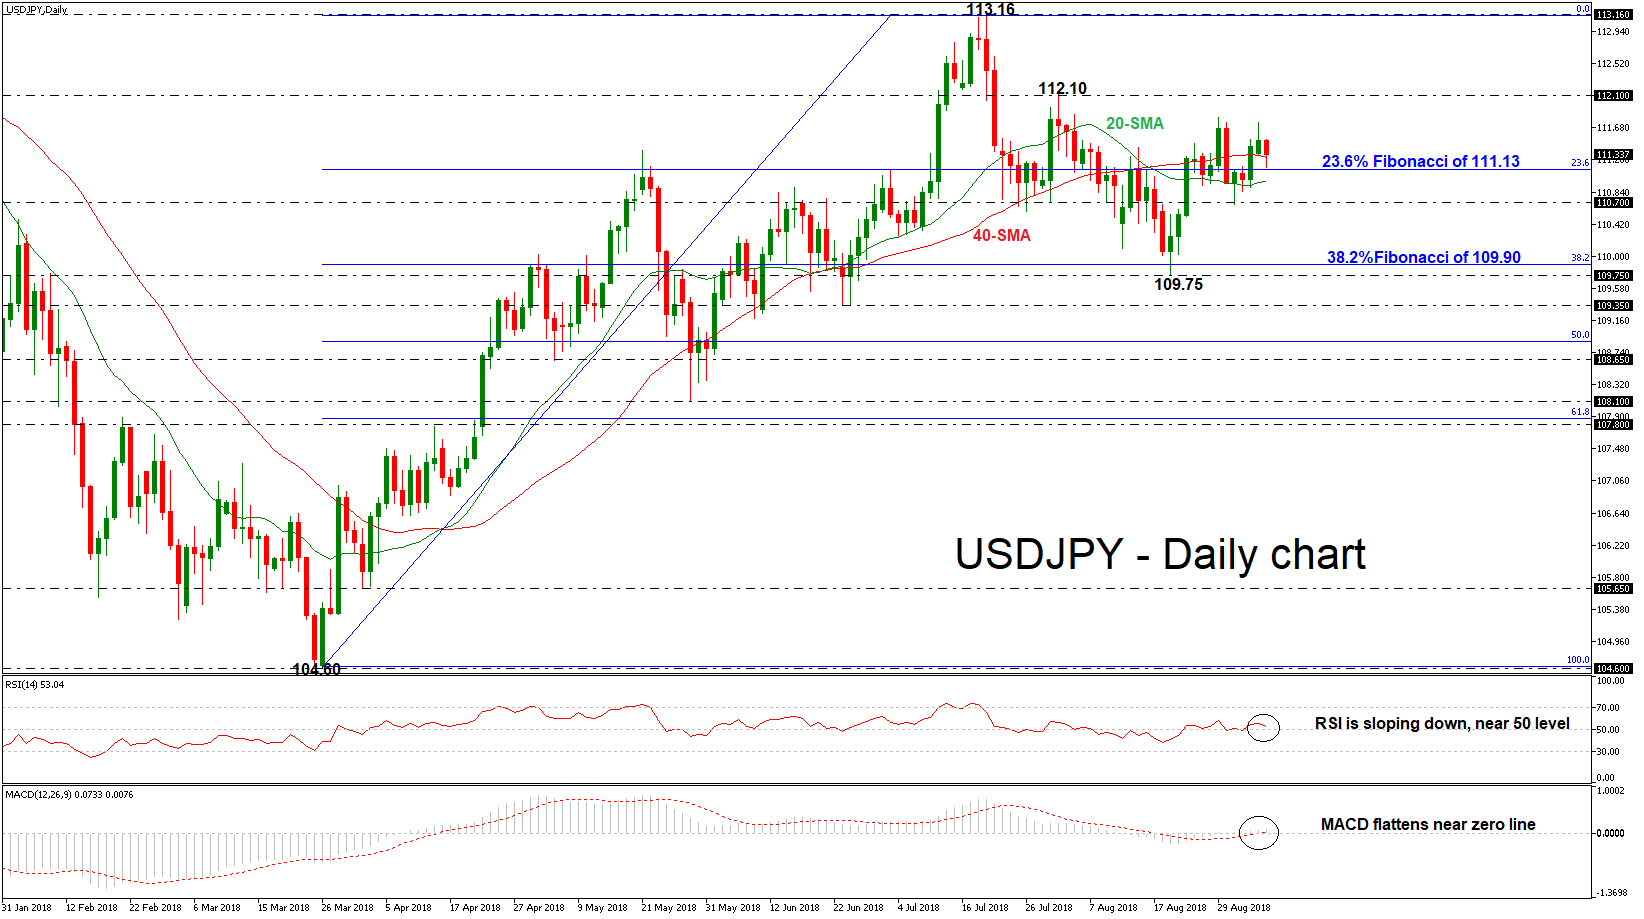
 USDJPY is hovering around the 23.6% Fibonacci retracement level of the upleg from 104.60 to 113.16, around the 111.13 barrier. According to the technical indicators, the market could maintain neutral momentum in the short-term as the RSI indicator is moving slightly to the downside near the threshold of 50, while the MACD oscillator is flattening near the zero line. Also, the pair still holds above the 20-and 40-simple moving averages but seems ready to slip below them.
On the downside, the price could attempt to fall below the 23.6% Fibonacci (111.13) and the 20-SMA, retesting the 110.70 support level, which if successfully broken could open the door for the 38.2% Fibonacci mark of 109.90. Should traders continue to sell the pair below this level, immediate support could come from the trough of 109.75 on August 21.
A strong bullish movement, however, could find resistance at the 112.10 hurdle, identified by the high of August 8. If the latter fails to halt bullish movements, the next target could be the 113.16 obstacle, where it topped on July 19.
Looking at the longer-term picture, the outlook is neutral over the past two months and only a decisive close above 113.16 could resume the bullish picture. On the other hand, a significant decline below May’s trough of 108.10 could shift the outlook to bearish.
Origin: XM


