


 4 hour
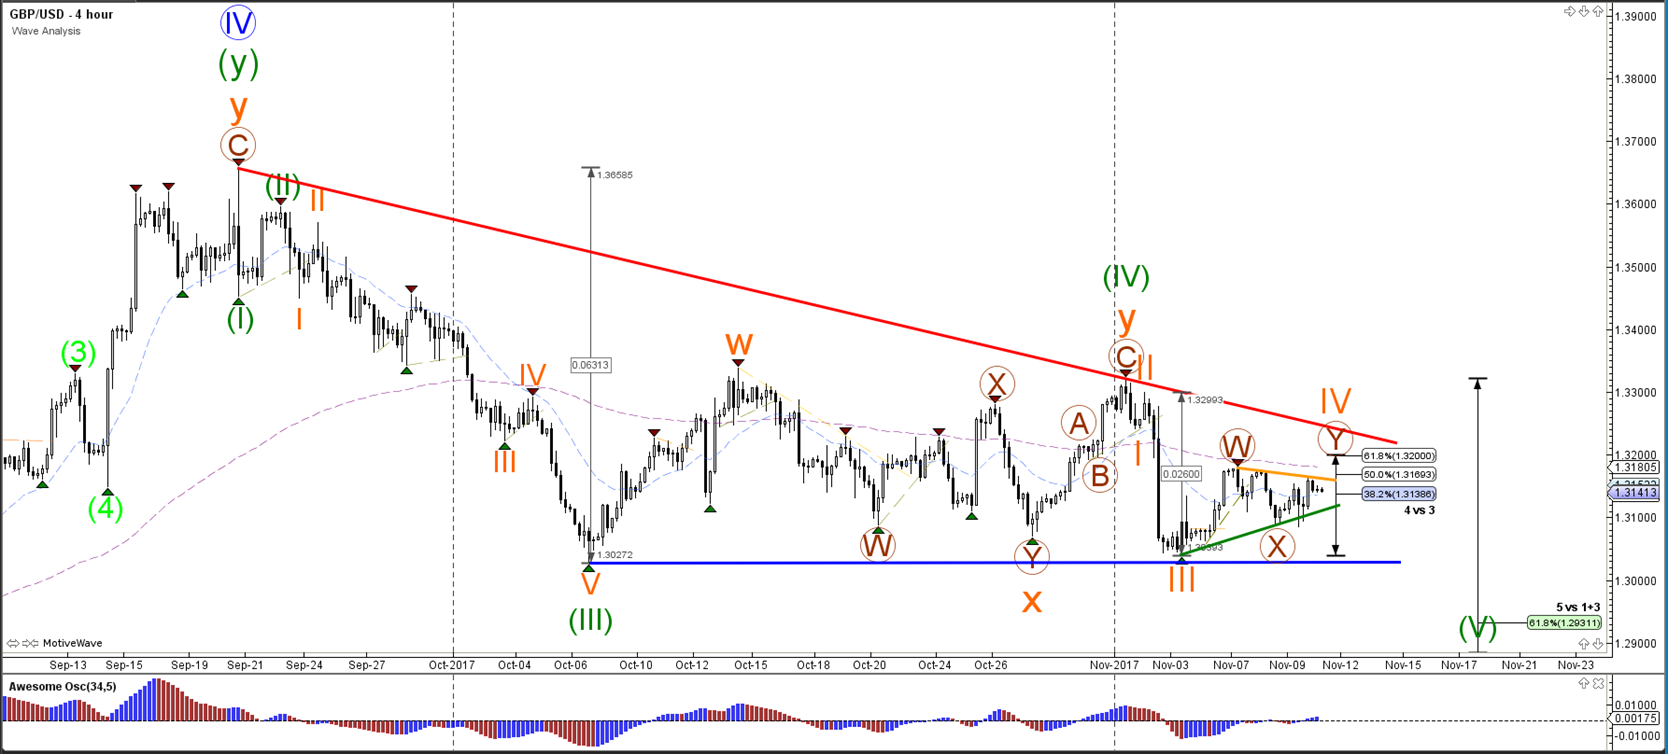
The GBP/USD is testing the Fibonacci levels of wave 4 (orange). A break above the 61.8% Fib makes a wave 4 (orange) less likely whereas a break below support could indicate a bearish breakout. Price is building a smaller triangle in a larger wedge pattern (red/blue lines).
1 hour
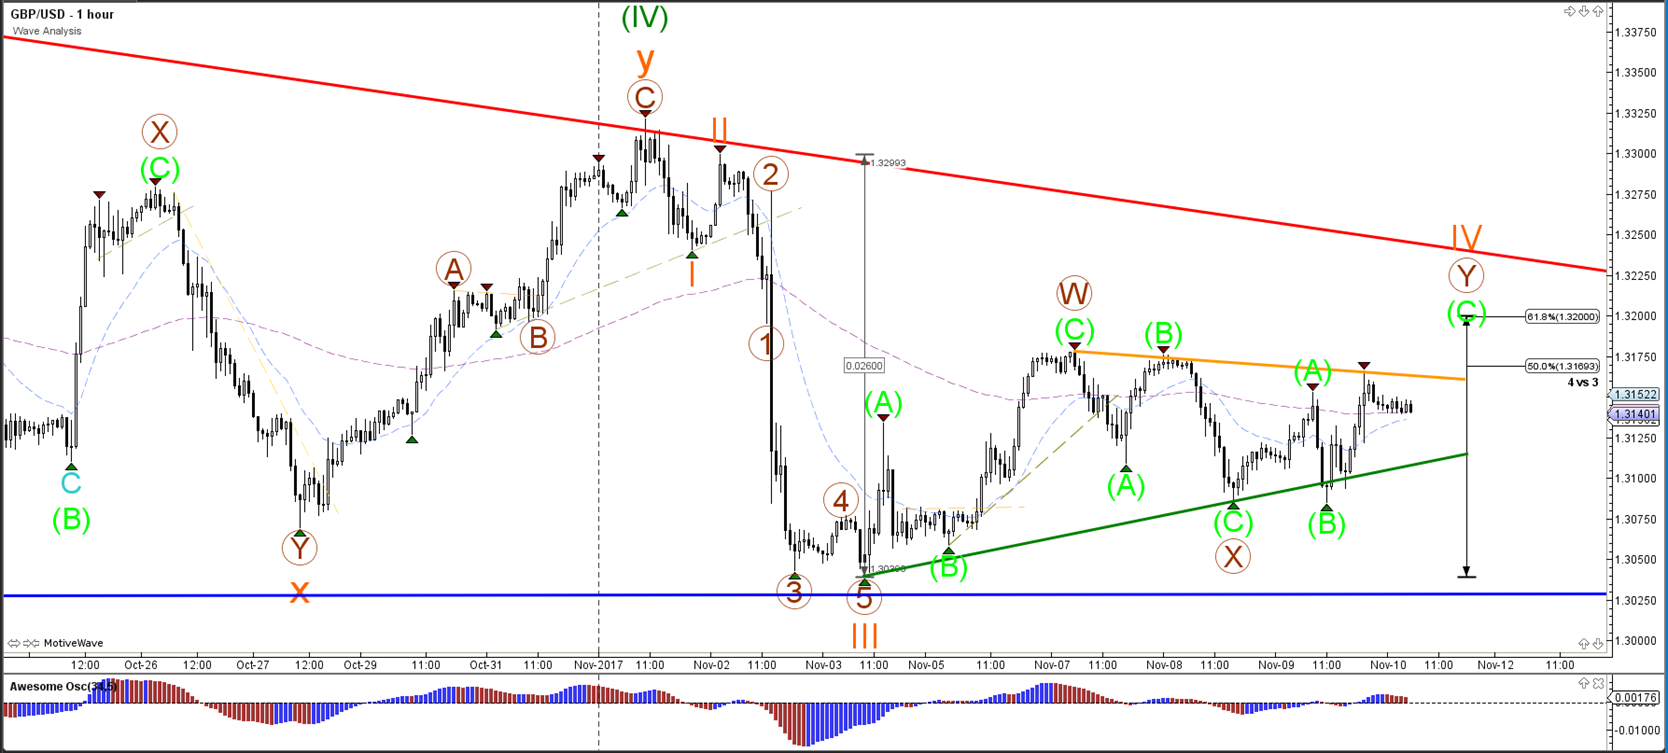
The GBP/USD is in a contracting triangle which is marked by clear support (green) and resistance (orange).
4 hour
1 hour
Origin: Admiral Markets


