


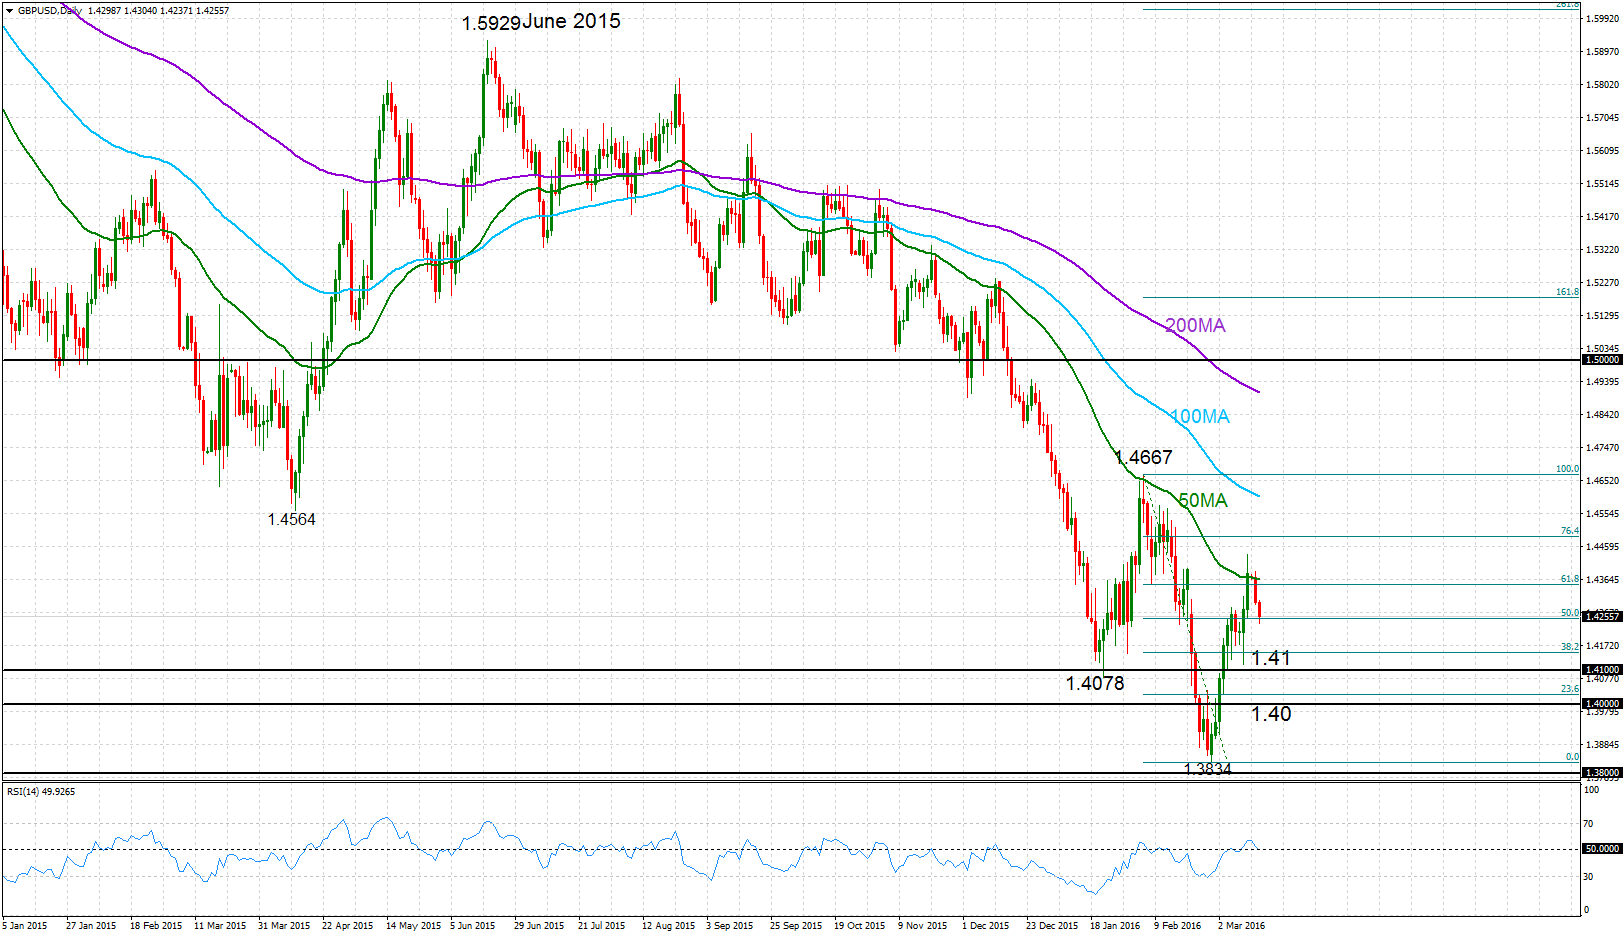
 GBPUSD found strong resistance at the 50-day moving average and has moved back down after several tests at this level around 1.4365. The pair is now testing support provided by the 50% Fibonacci retracement level of the decline from 1.4667 to 1.3834. A daily close below this 50% Fibonacci level at 1.4248 would strengthen the bearish bias.
Momentum has turned negative which is a bearish signal – RSI has fallen and is testing the 50 level. There is now scope for prices to target the key 1.41 level. A break below this would bring 1.40 in sight.
Looking at the bigger picture, the moving averages are negatively aligned and declining, which highlight the underlying bearish market structure. GBPUSD has been steadily falling since June 2015.
Origin: XM


