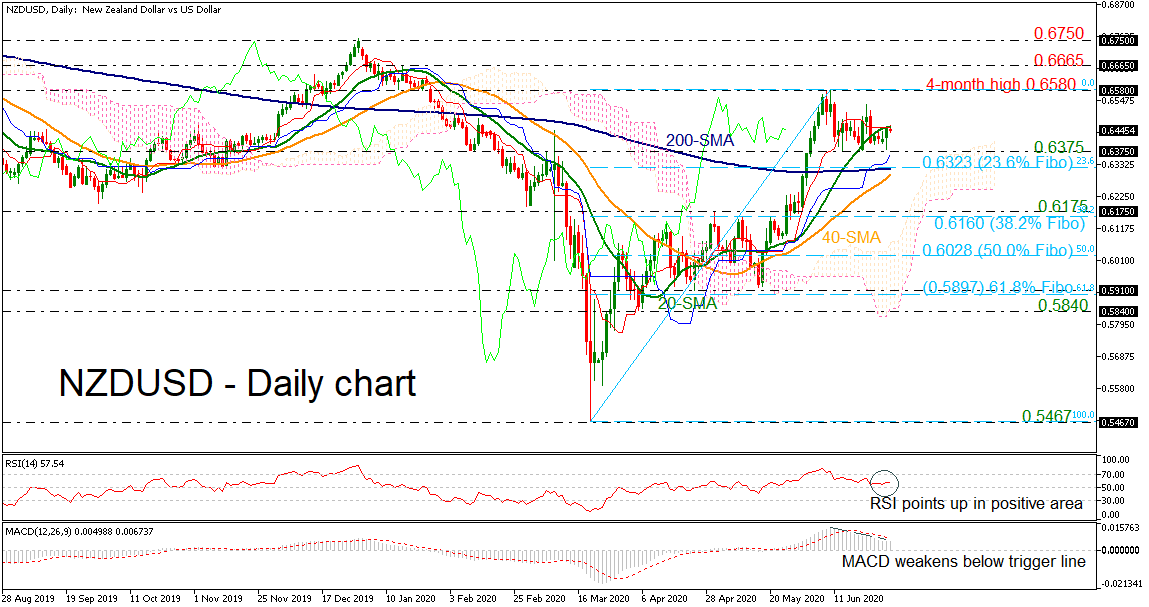
 NZDUSD is capped by the 20-day simple moving average (SMA) and the red Tenkan-sen line in the short-term and has been moving sideways over the past three weeks. The momentum indicators are facing contradicting signals as the RSI is pointing marginally up in the positive region, while the MACD oscillator is standing beneath its trigger line and is losing ground.
If the price continues to fall, immediate support would come from the 0.6375 barrier and the 23.6% Fibonacci retracement level of the upward wave from 0.5467 to 0.6580 at 0.6323, which coincides with the 200-day SMA. Slightly below this line, the 40-day SMA is appearing near 0.6296 ahead of the 0.6175 support and the 38.2% Fibonacci of 0.6160.
On the flip side, an increase above the 20-day SMA could drive the bulls until the four-month peak of 0.6580 before extending the bullish structure to 0.6665. Even higher, the price could hit the 0.6750 resistance, taken from the peak on December 2019.
Concluding, the market has been in a bullish mode since the bounce off 0.5467, achieved on March 19. More upside pressure above 0.6750 could switch the longer-term picture from negative to positive.
Origin: XM