 USD/JPY trades sideways, but a head and shoulders pattern near 151 hints at bearish risk.
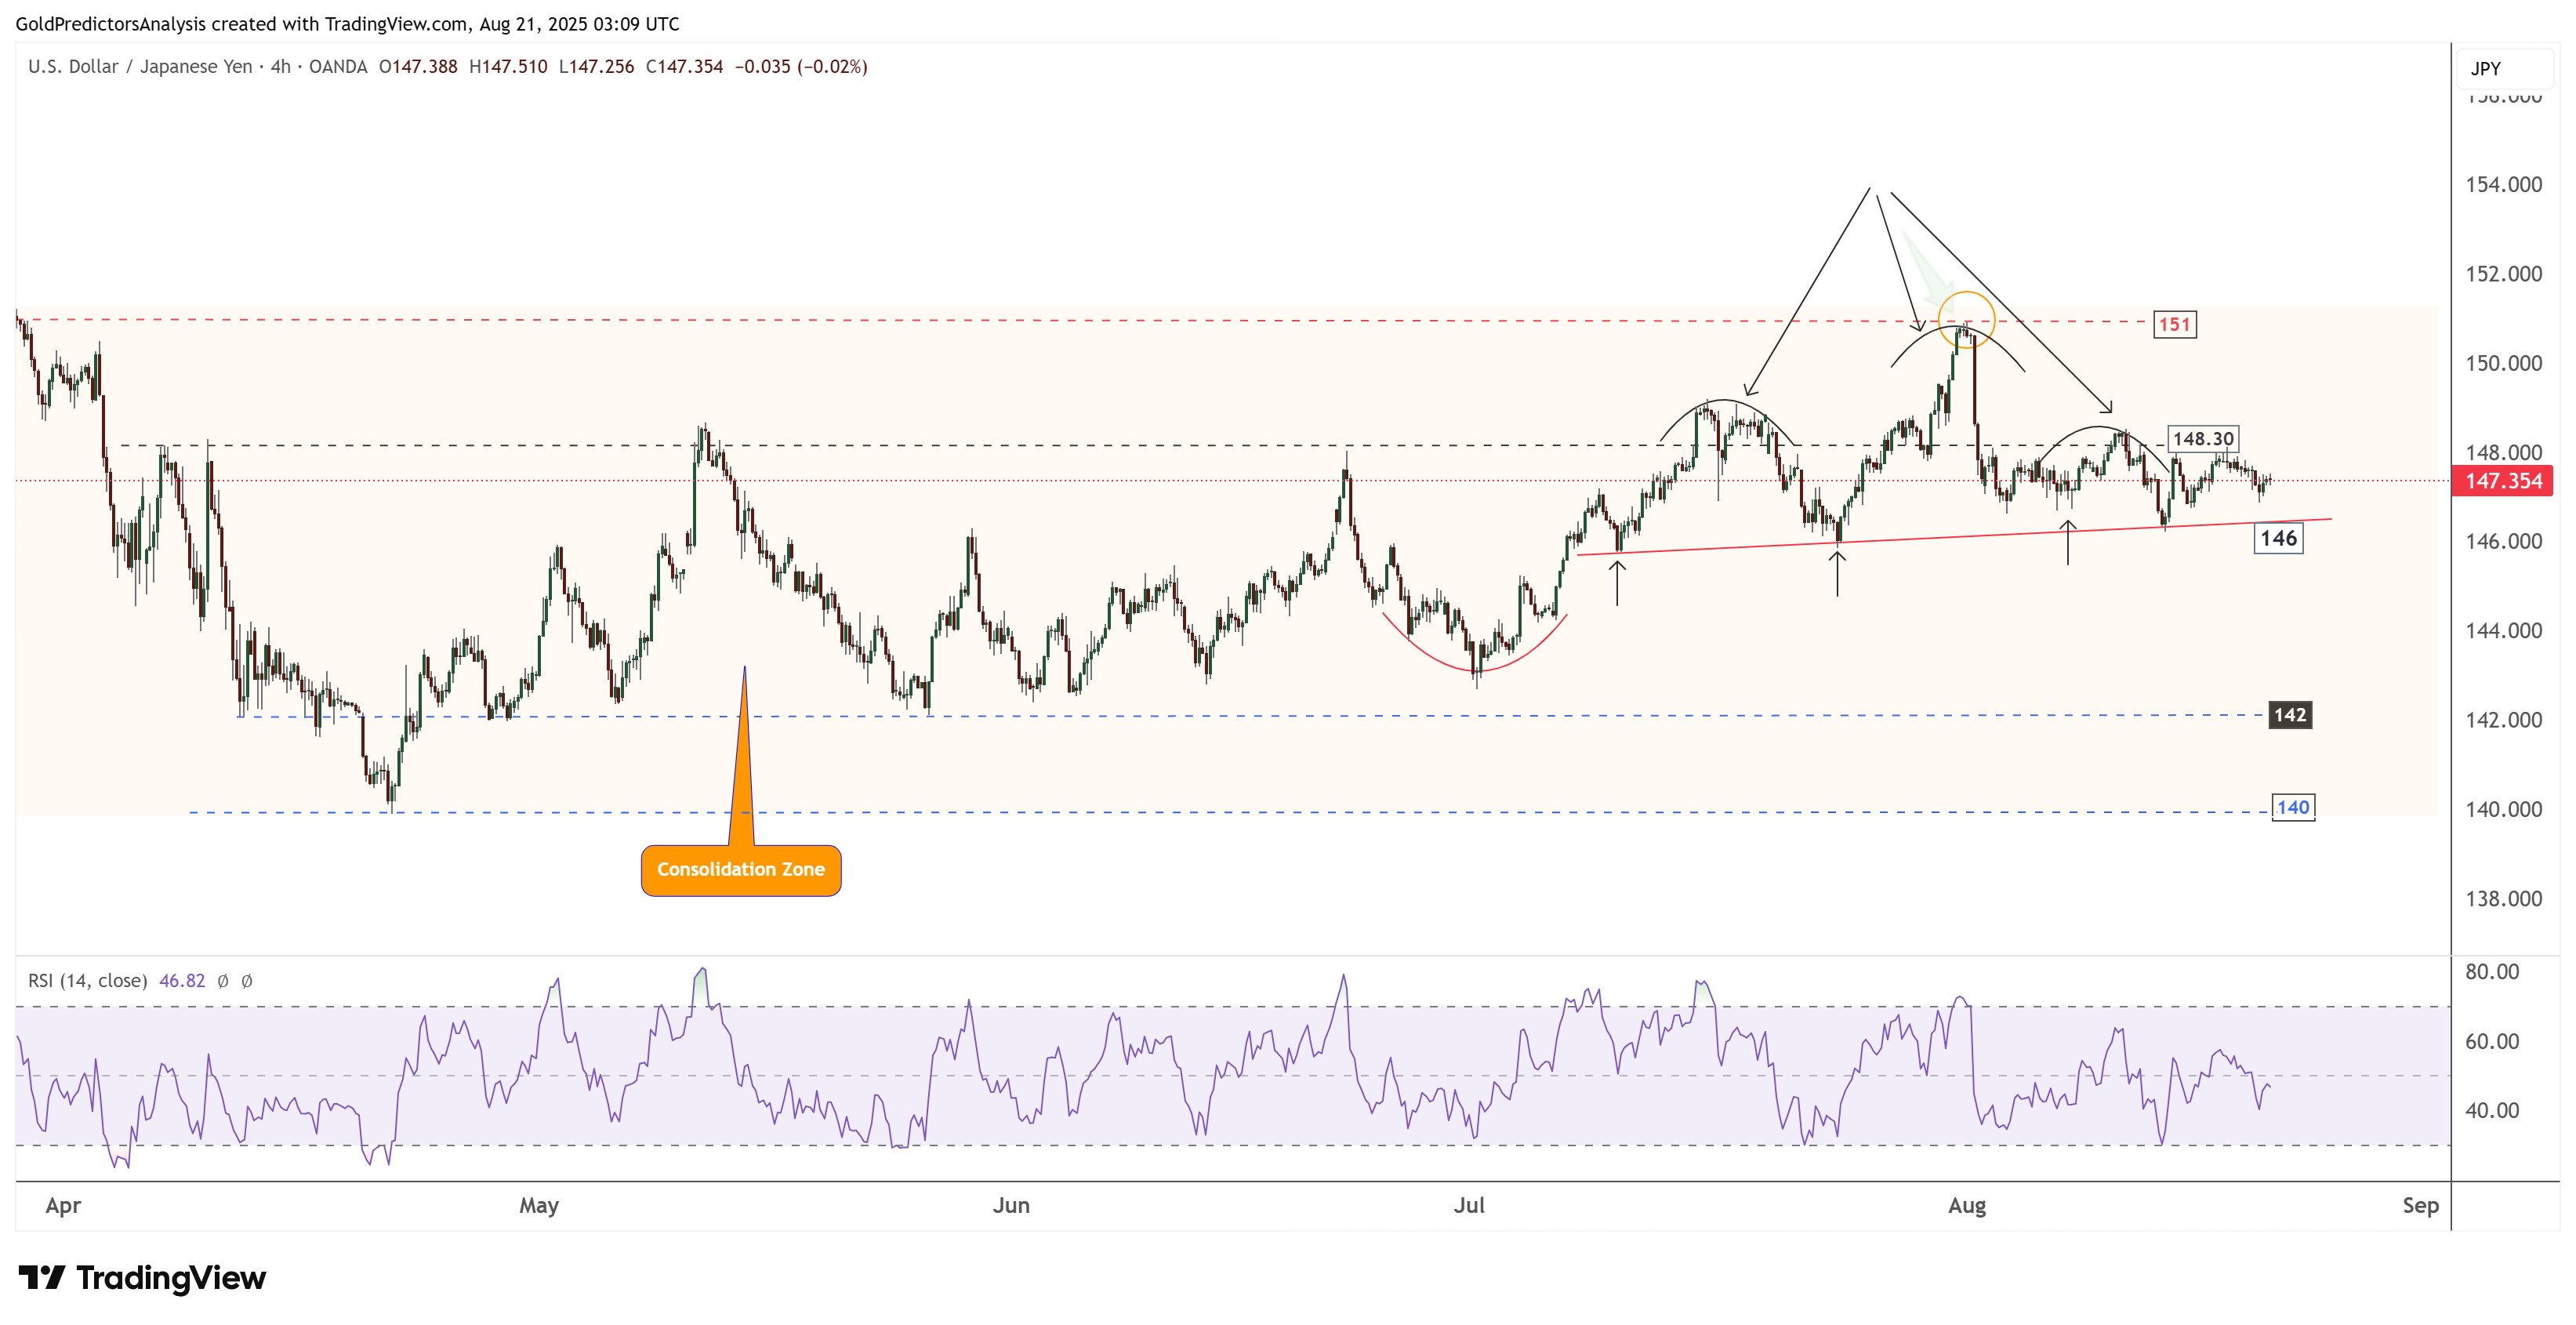
The 4-hour chart for USD/JPY shows that the pair is trading within a sideways range between the 140 and 151 region. However, the pair failed to break above the 151 level in July 2025 and formed a head and shoulders pattern with a neckline at 146.
A break below 146 would likely trigger a strong downside move toward the 142 level.