 AUD/USD dropped to the 0.6550 level as the US dollar continued to rally from its long-term support of 96.50. The pair gave up early gains as market sentiment turned risk-off. Traders responded to global trade tensions with caution.
US President Donald Trump imposed a 30% tariff on imports from the EU and Mexico. This move came after earlier tariffs on Japan, South Korea, Canada, and copper imports. The protectionist stance increased demand for safe-haven currencies. As a result, the US Dollar strengthened and pressured the AUD.
However, the broader trend for the US Dollar Index remains negative. The market is reacting to the long-term support near 96.50. The actual move in the US Dollar Index will likely develop after the release of the US inflation data. A higher inflation reading could reduce the chances of Fed rate cuts in September, supporting USD strength and limiting AUD/USD recovery. The chart below shows that the annual inflation rate in the US accelerated to 2.7% in June 2025. This was the highest level since February, as businesses began passing on higher import costs stemming from newly imposed tariffs
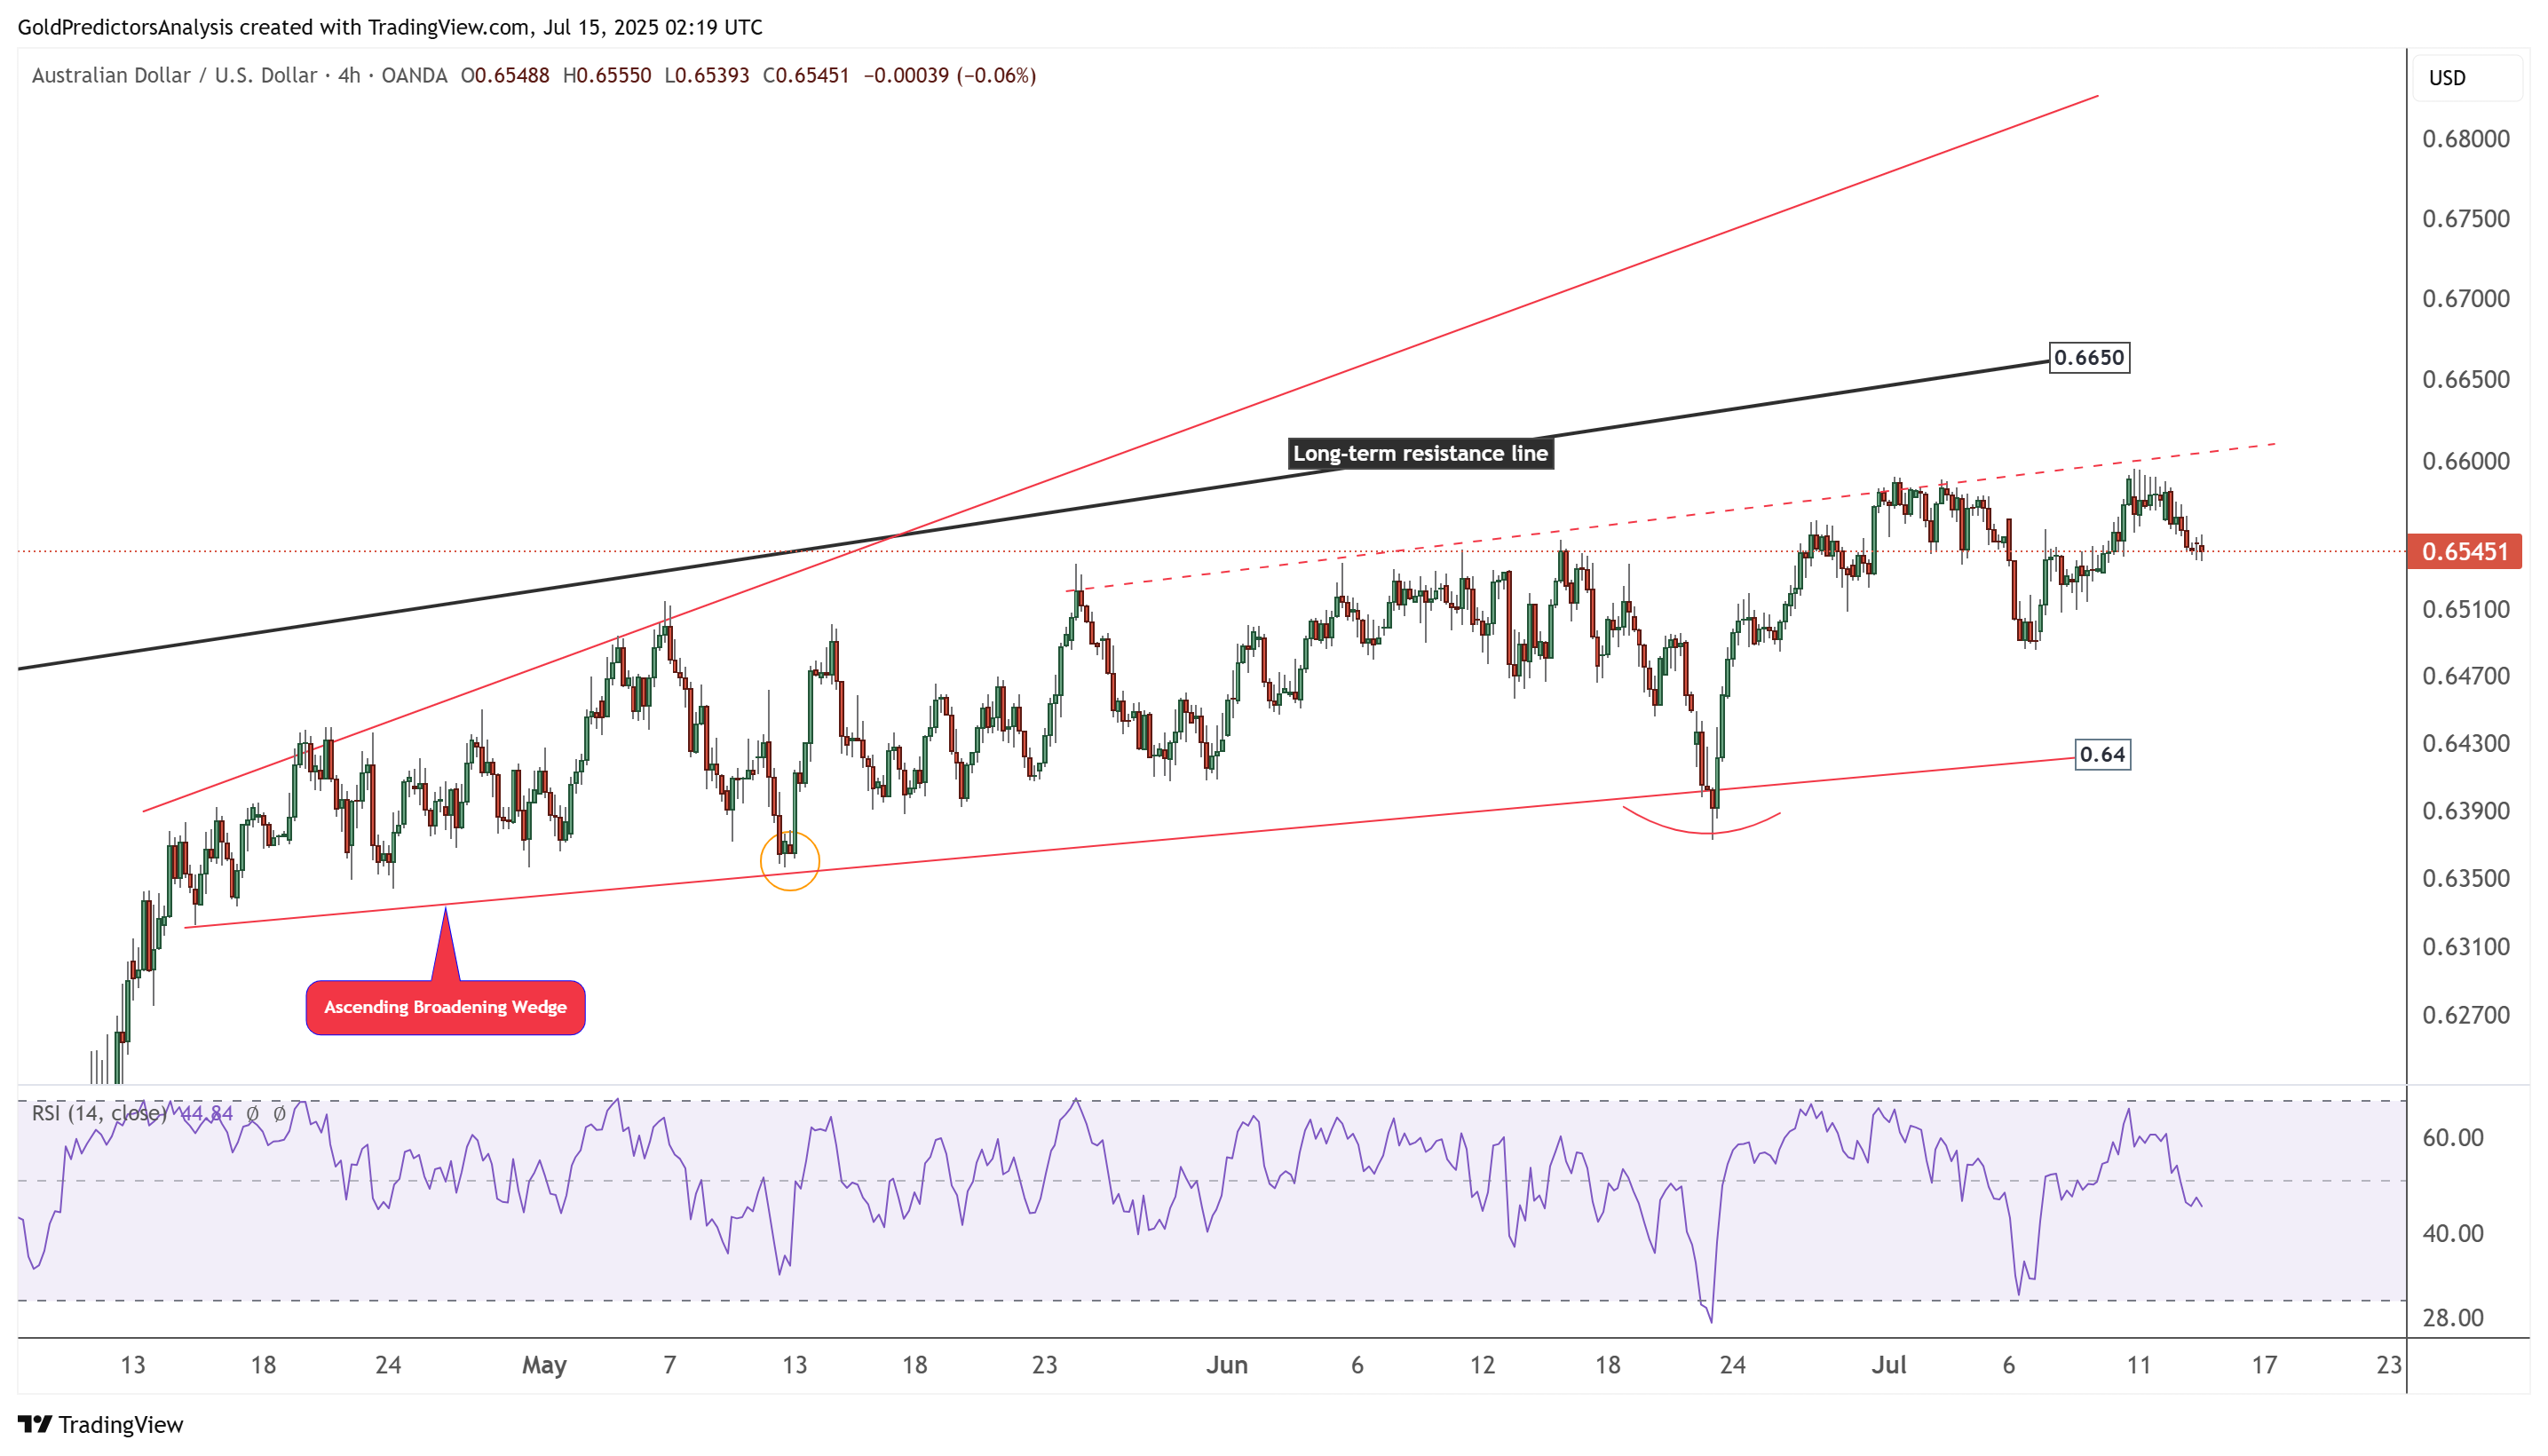
AUD/USD Technical Analysis – Ascending Broadening Wedge Pattern
The 4-hour chart for AUD/USD shows that the pair is trading within an ascending broadening wedge pattern. It is consolidating between the 0.6400 and 0.6650 levels. A break of either level will define the next move in AUD/USD. Strong demand, a sharp surge in gold prices, and the bearish trend in the USD Index all suggest bullish momentum in AUD/USD. A break above 0.6650 will likely push the pair higher.