 The Australian Dollar rose for the second session in a row. It held its ground despite a weaker-than-expected trade surplus. Australia posted a $5,413 million trade surplus in April, down from $6,892 million in March, as shown in the chart below.
Moreover, the support came from China’s Services PMI, which improved to 51.1 in May from 50.7. Due to close trade ties, the Aussie Dollar often reacts to Chinese data. Despite falling exports, the better Chinese services data supported the AUD. Local services and GDP data remained mixed, suggesting economic fragility.
The chart below shows that the exports declined by 2.1%, while imports rose by 3.3%. These figures signalled slowing trade momentum but failed to shake the AUD.
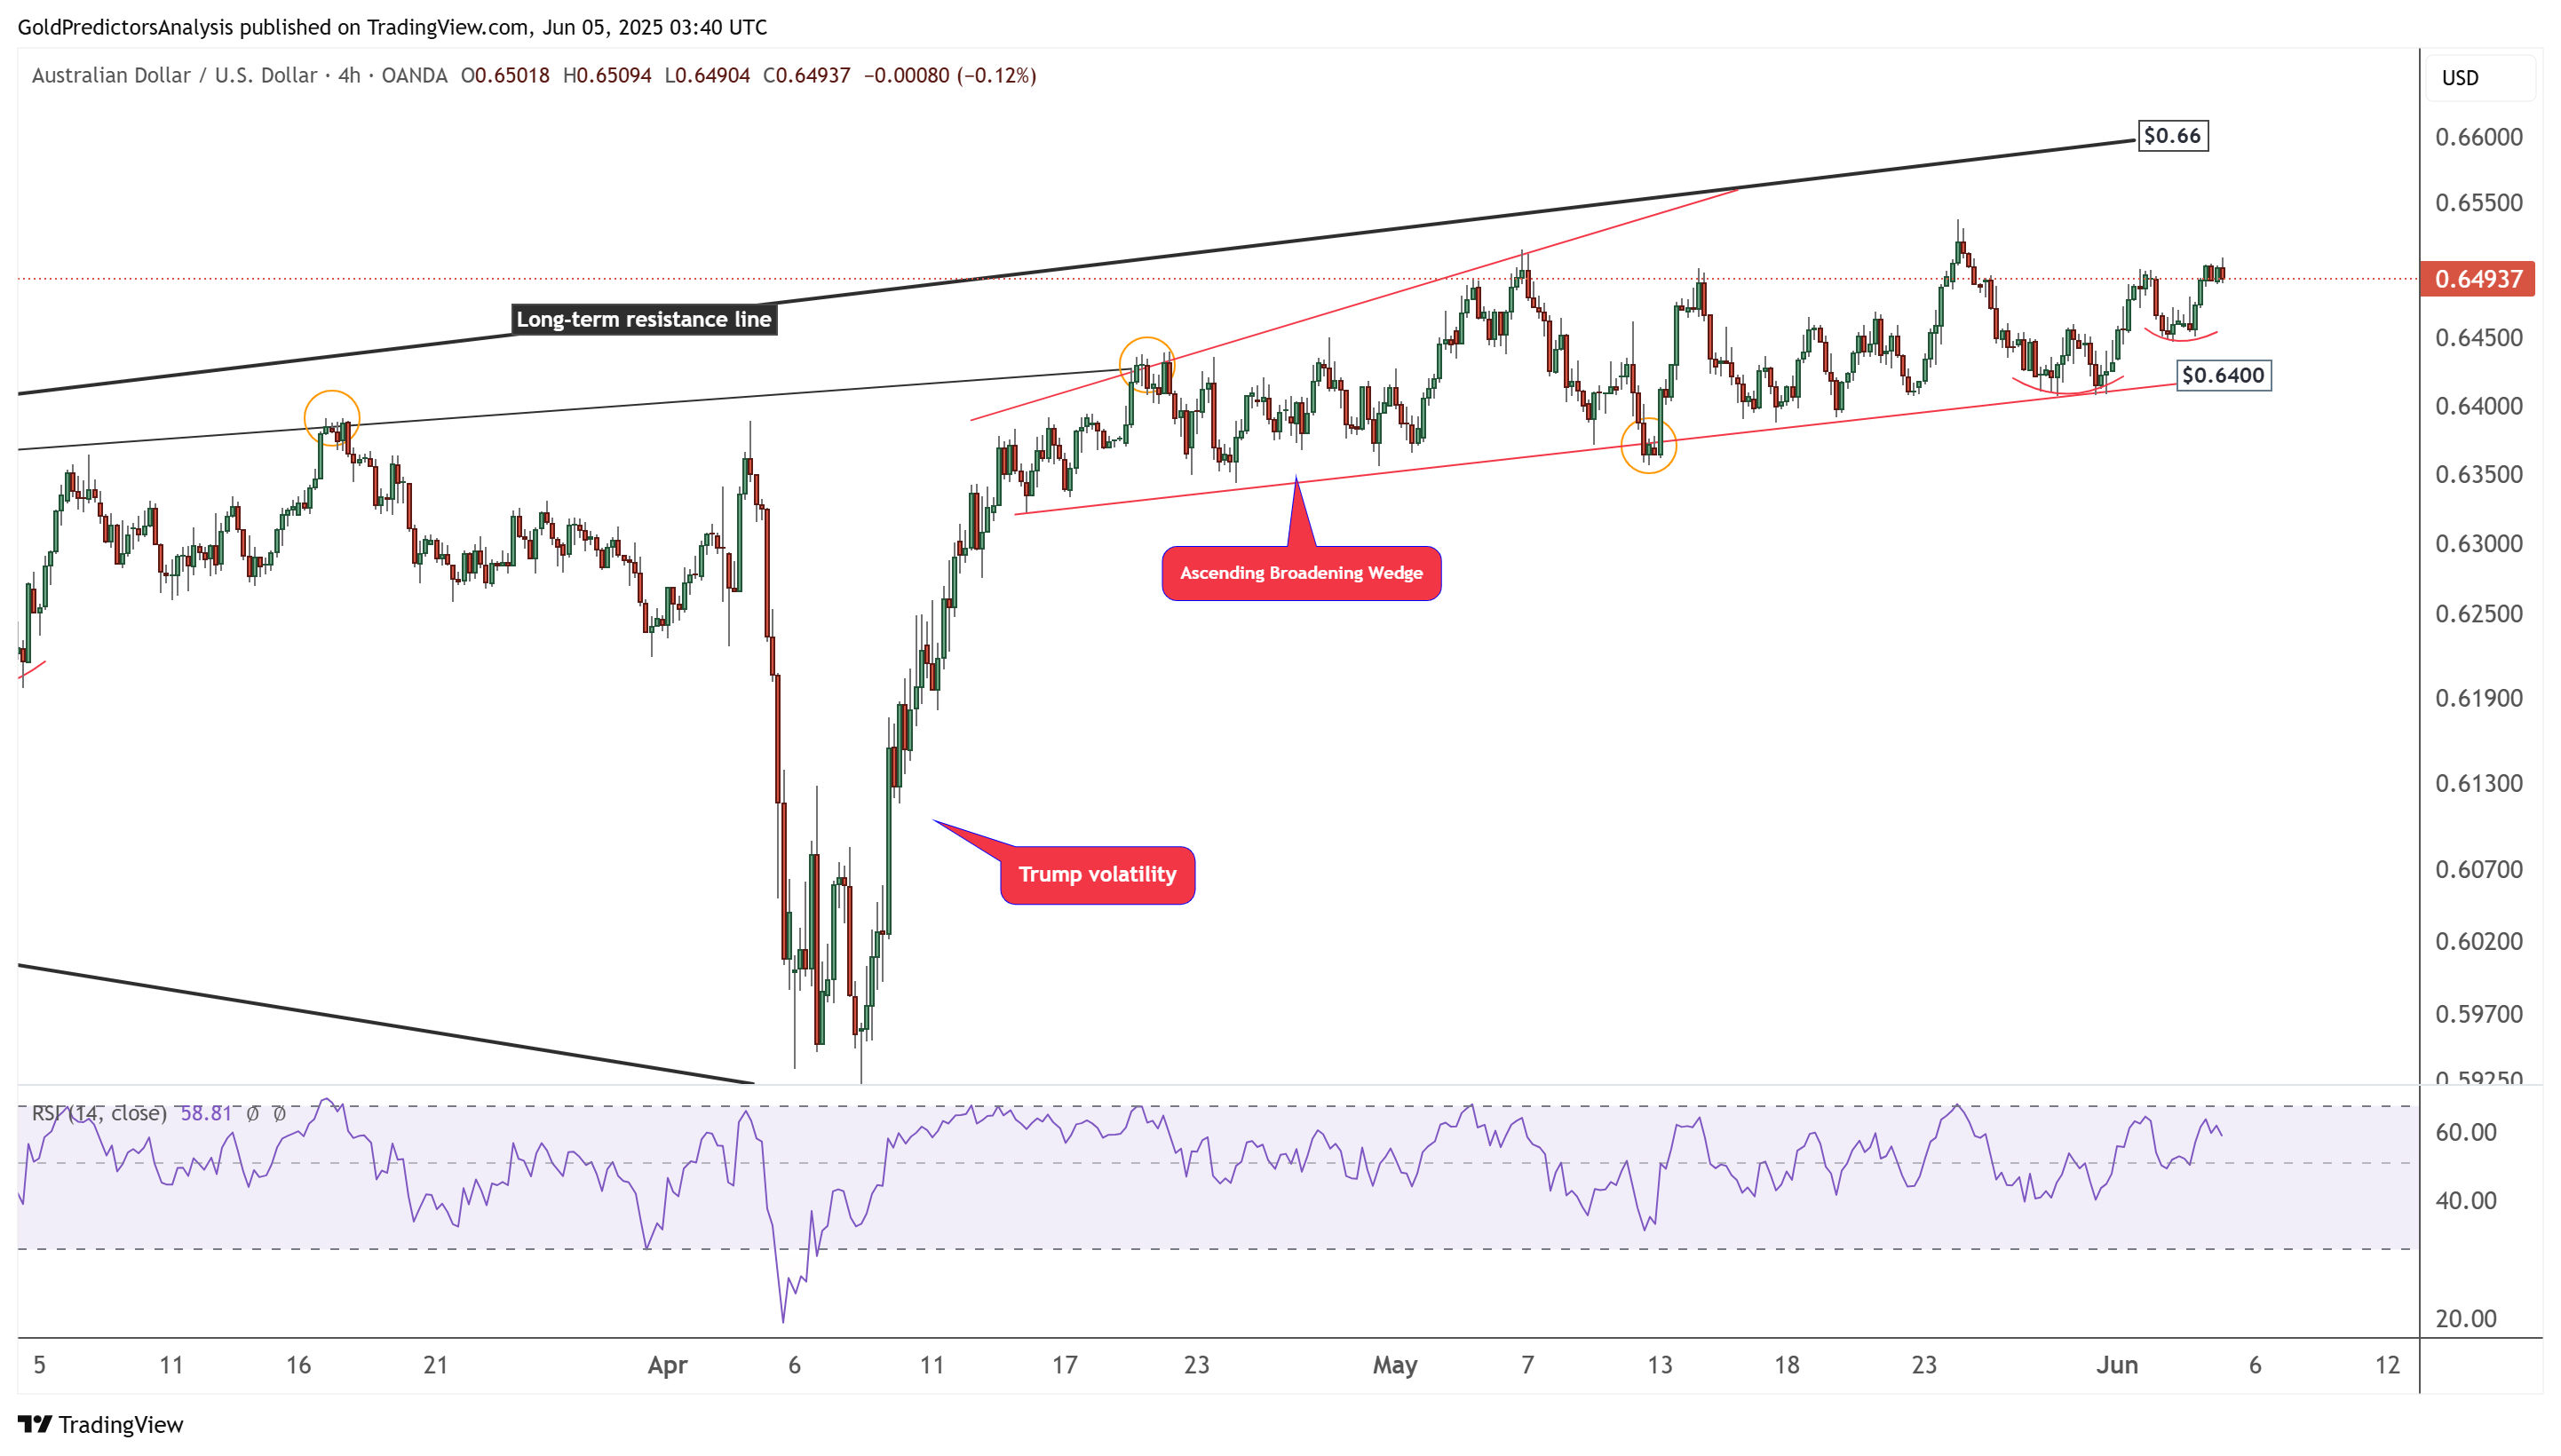
The 4-hour chart for AUD/USD shows that the pair is trading within an ascending broadening wedge pattern. The formation of strong support near the $0.6400 area indicates a likely continuation toward $0.6600. The weakness in the US Dollar Index is driving AUD/USD higher.