 US Dollar Strength and China’s Growth Shape AUD/USD Direction
Meanwhile, the US Dollar Index (DXY) rebounded to around 99.60, adding further pressure on AUD/USD. US retail sales data showed strength, with retail sales rising 1.4% in March, signalling robust consumer spending, as shown in the chart below. This followed a 0.2% gain in February, exceeding the 1.3% forecast. Additionally, comments from Fed officials reinforced a cautious stance on rate cuts, as inflation remains above the 2% target.
The chart below shows China’s solid Q1 GDP growth at 5.4% and strong industrial production at 7.7%. This strong growth offers long-term support to the Australian Dollar. However, short-term momentum remains uncertain due to weak local data, unclear rate policy, and a strong US Dollar. Despite China’s retail sales rising 5.9%, AUD/USD struggles amid global monetary policy divergence and market volatility.
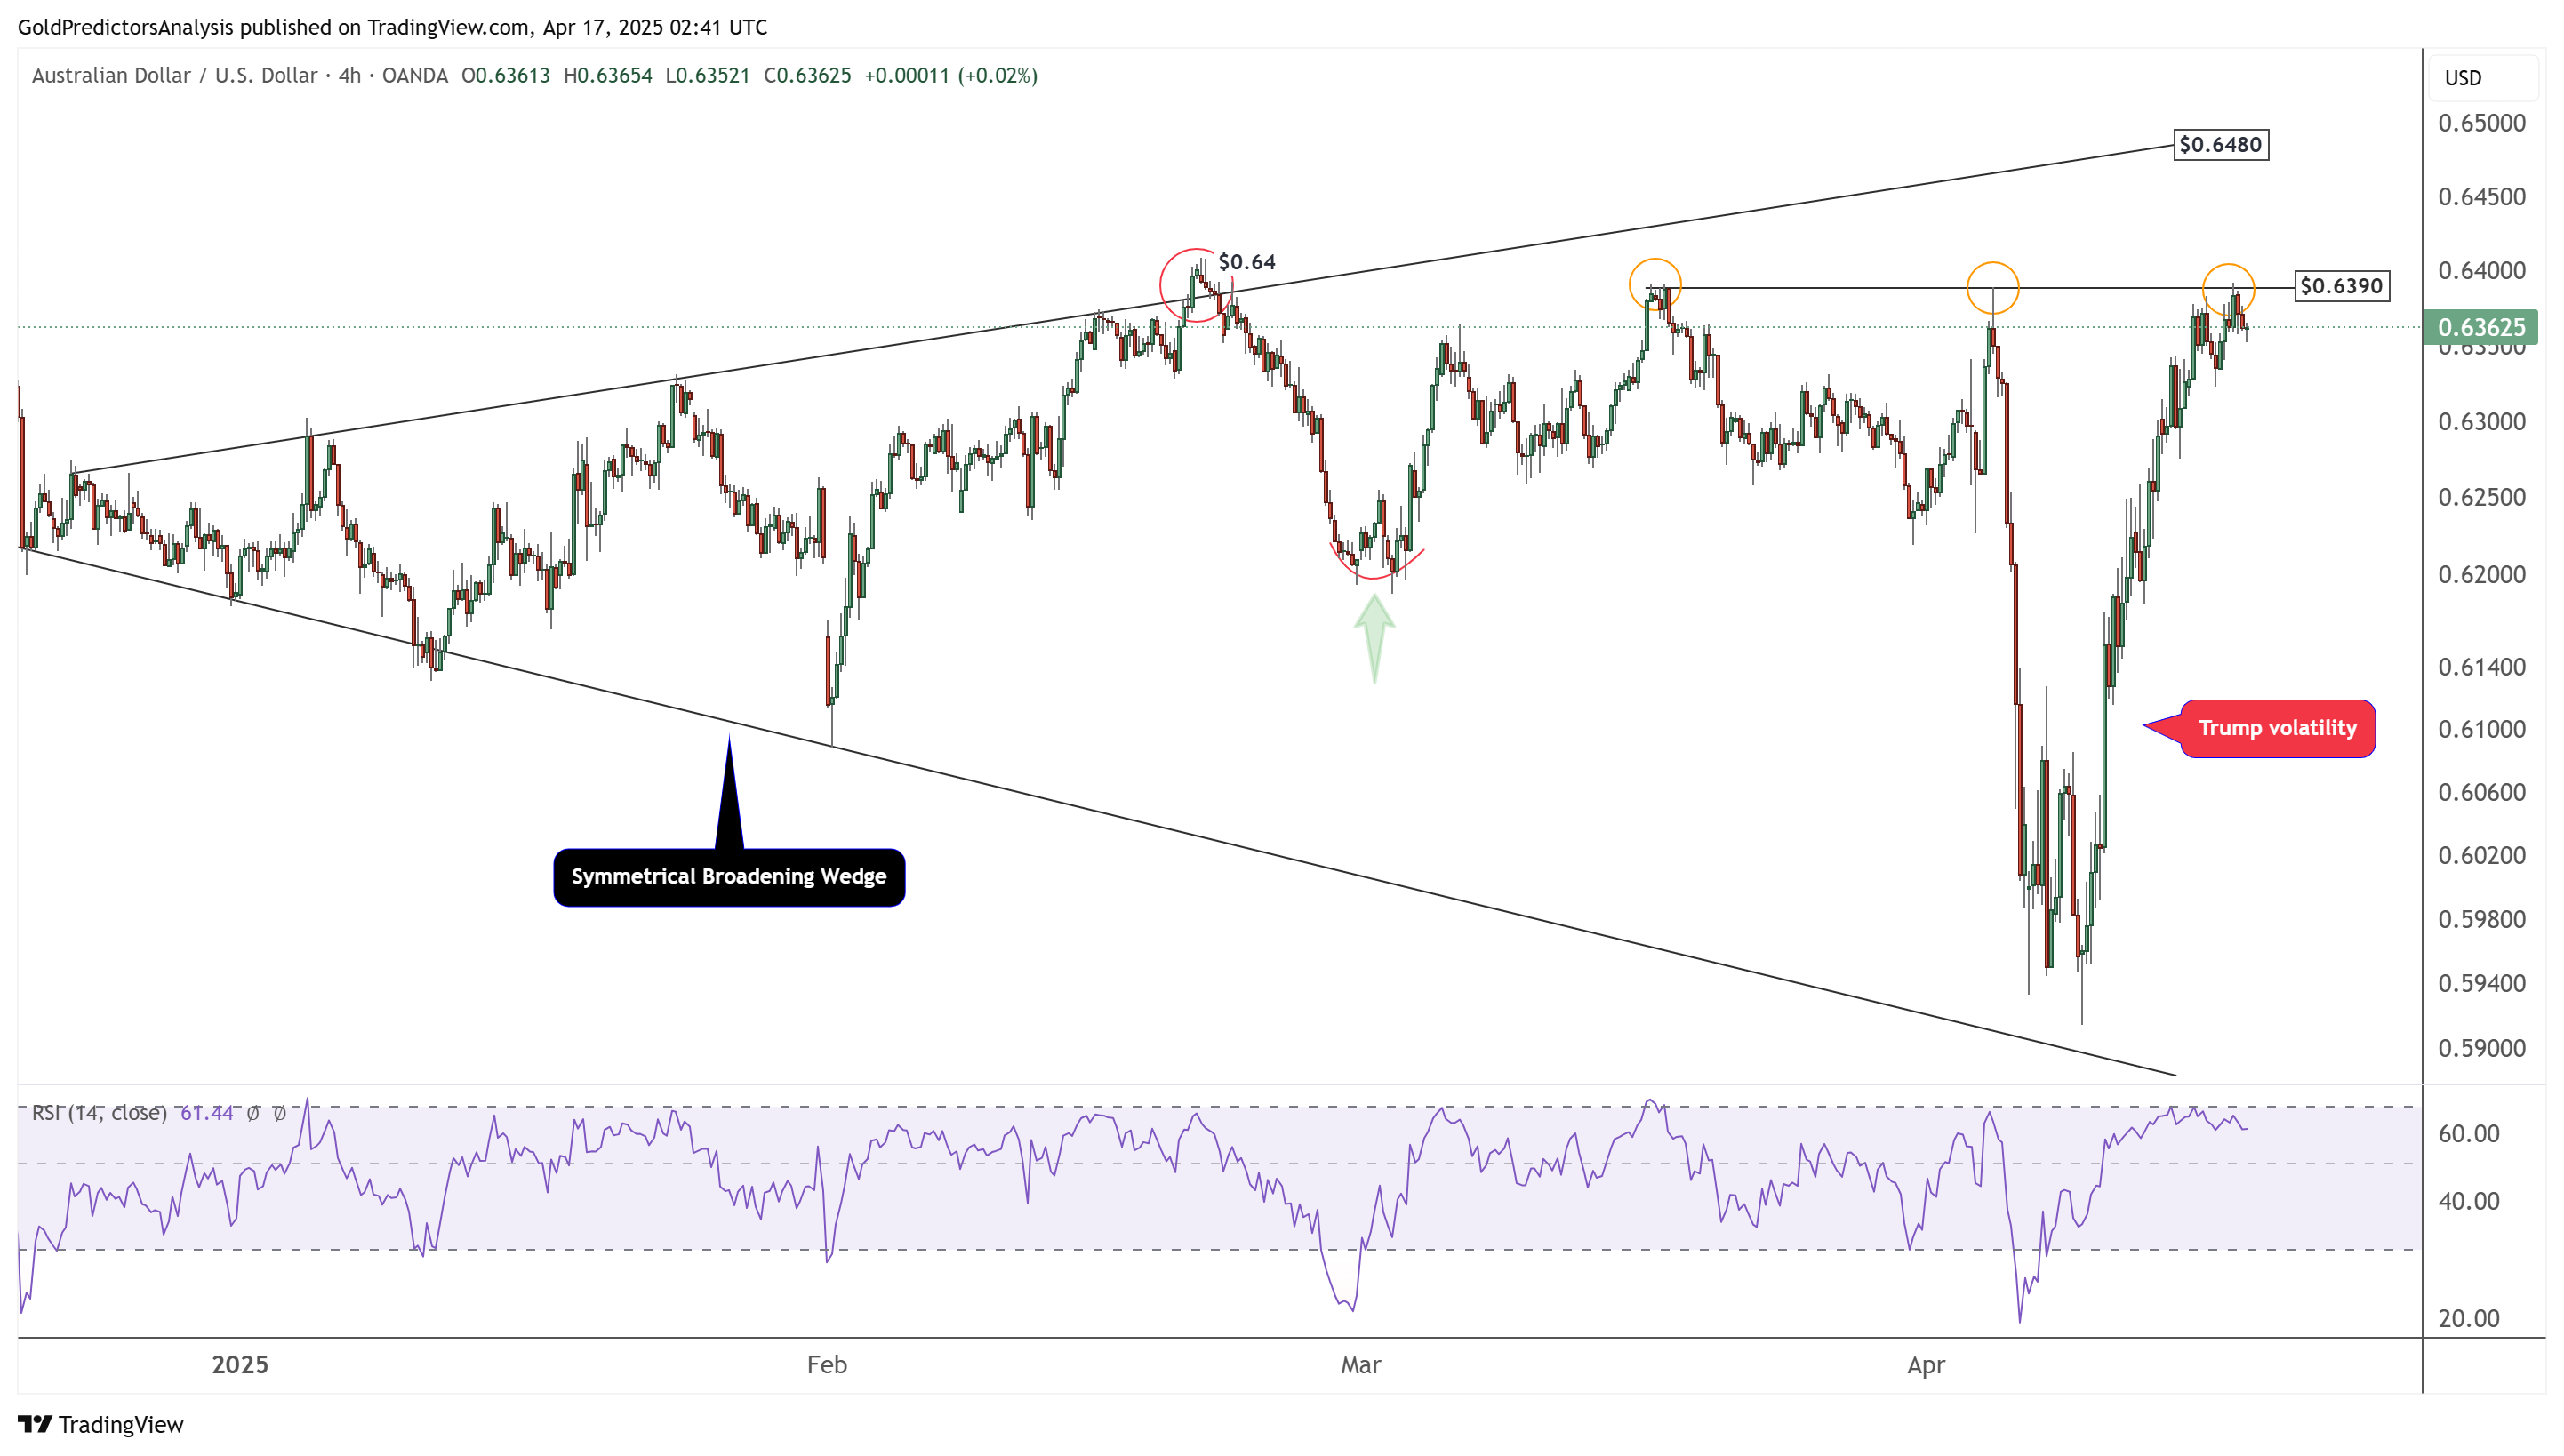
AUD/USD Technical Analysis – Key Resistance
Strong volatility is observed in the 4-hour chart below. This volatility is reflected in the ascending broadening wedge pattern, where the price fluctuates within its boundaries. The price recently reached $0.6390, providing strong resistance within the wedge. However, given the bearish trend in the US dollar, rising safe-haven demand for gold (XAU), and gold printing record highs, the likelihood of an upward breakout in AUD/USD is high. A break above $0.6480 would signal a strong bullish trend in AUD/USD.