Русский


 WTI crude oil (CL) is trading around $67.40 in the early Asian session on Thursday. The price continues to rebound from the support as oil inventories remain tighter than expected. However, concerns over a US economic slowdown and the impact of tariffs on global trade could limit further gains.
Crude oil inventories increased last week but at a slower pace than expected. The US Energy Information Administration (EIA) reported a stockpile rise of 1.448 million barrels for the week ending March 7, as shown in the chart below. This increase was lower than the previous week’s 3.614 million barrels and the market expectation of 2.1 million barrels. Analysts suggest that stronger demand for gasoline and diesel contributed to this smaller-than-expected build.
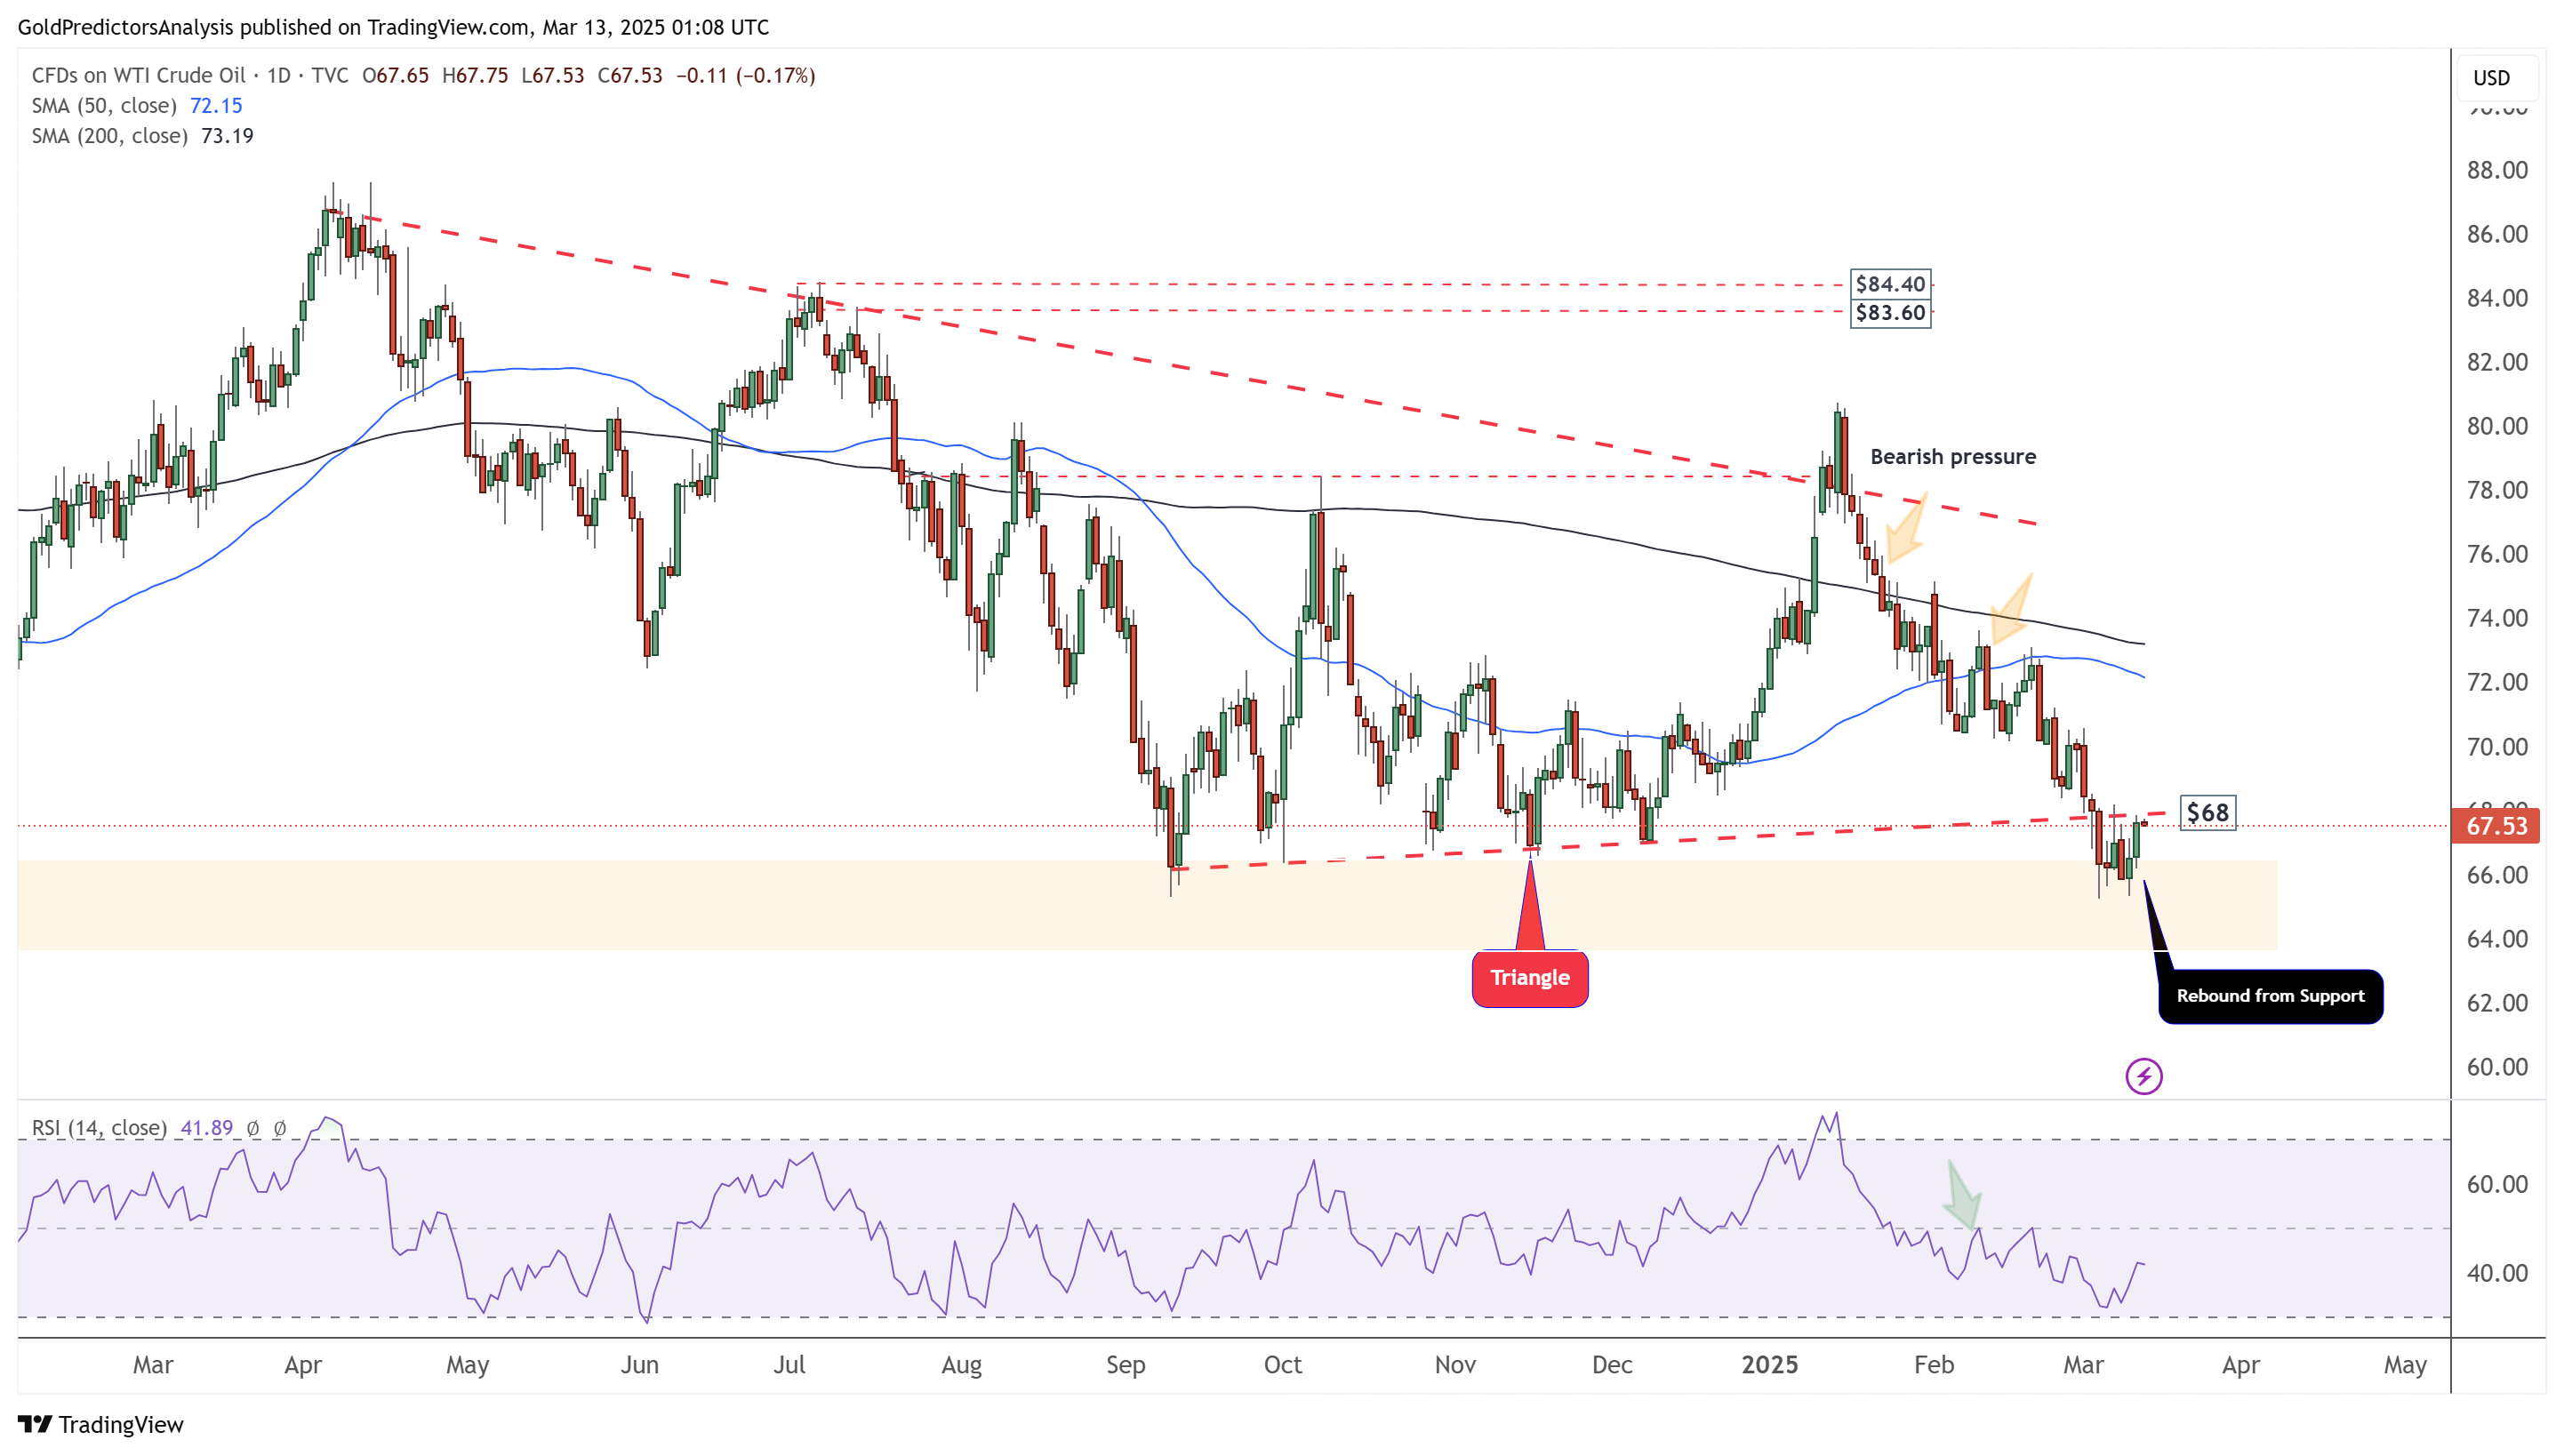
The daily chart for WTI oil shows that the price rebounds from the support region and touches the red-dotted trendline at $68, where the breakout occurred. However, the orange zone represents long-term support for WTI crude oil, and a failure to break below this level may trigger a strong rebound. Despite this, the oil market remains in a bearish trend, and this rebound is primarily due to oversold conditions following the recent price decline.
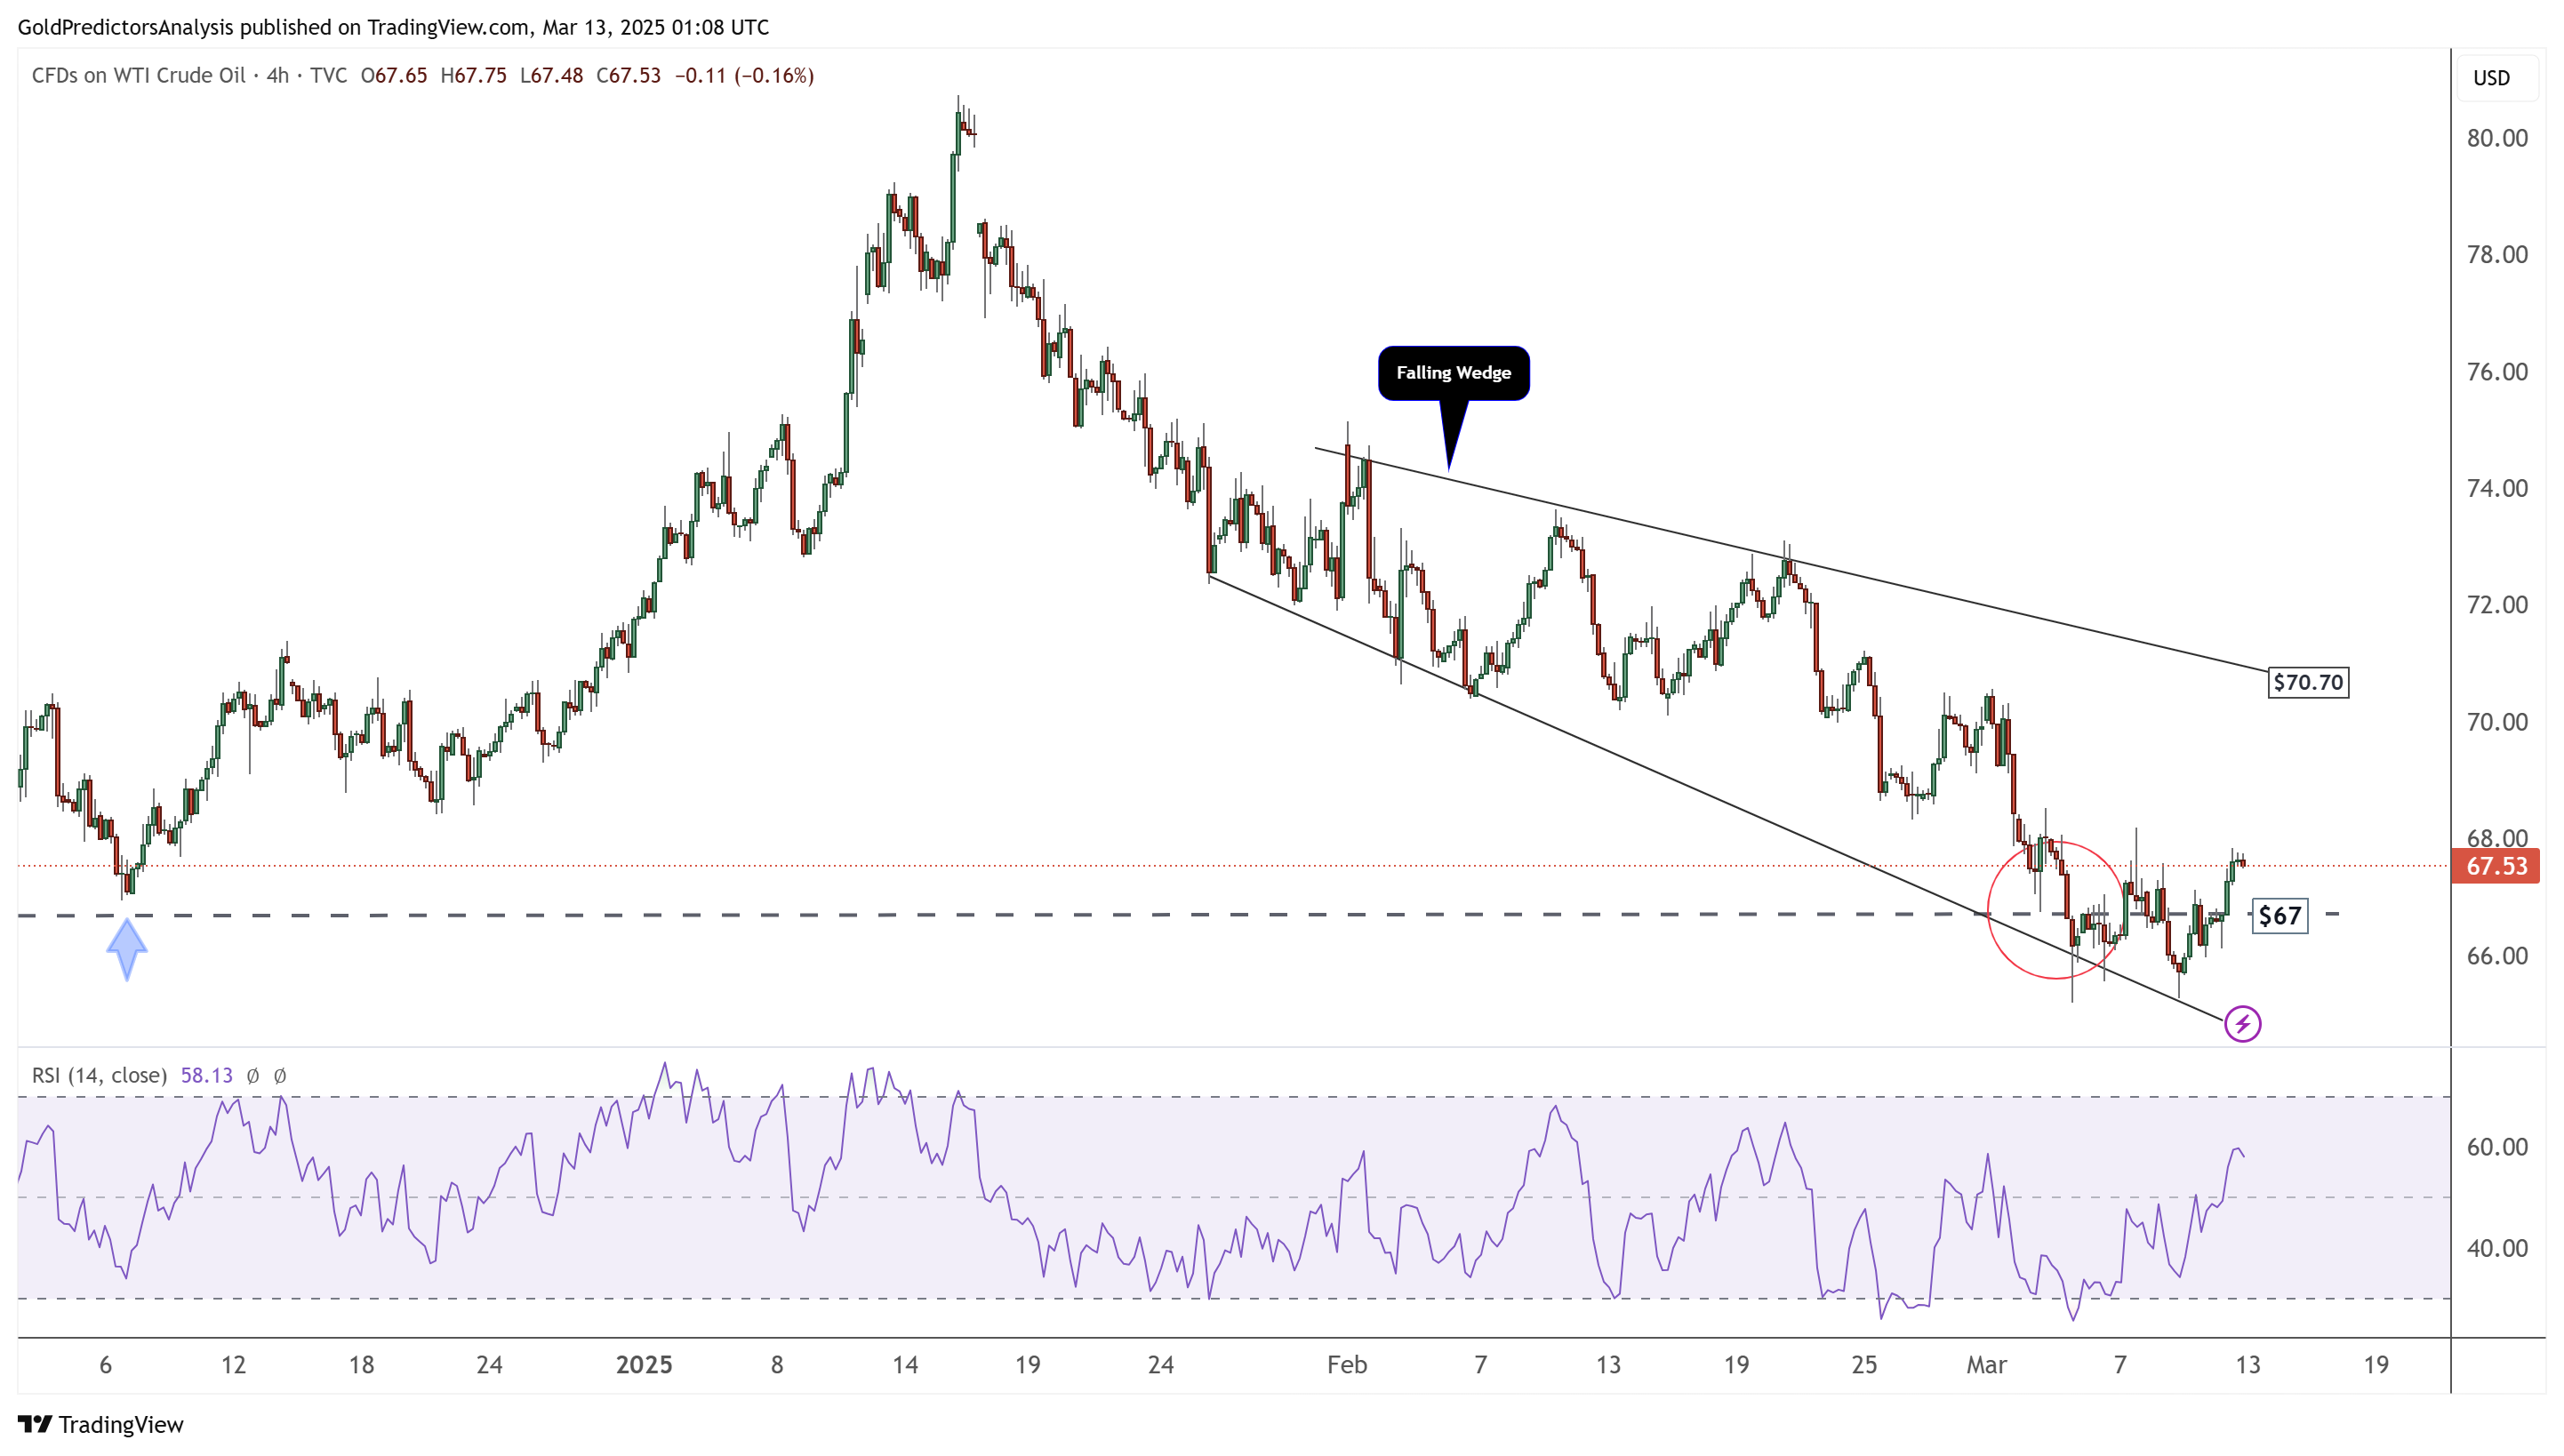
Oil 4-Hour Chart – Falling Wedge Pattern
The 4-hour chart for WTI crude oil shows that the price rebounded from support, which formed at the base of the falling wedge pattern, with consolidation around $67. The strong resistance lies near $70.70. The downtrend will continue as long as the price remains below $70.70.