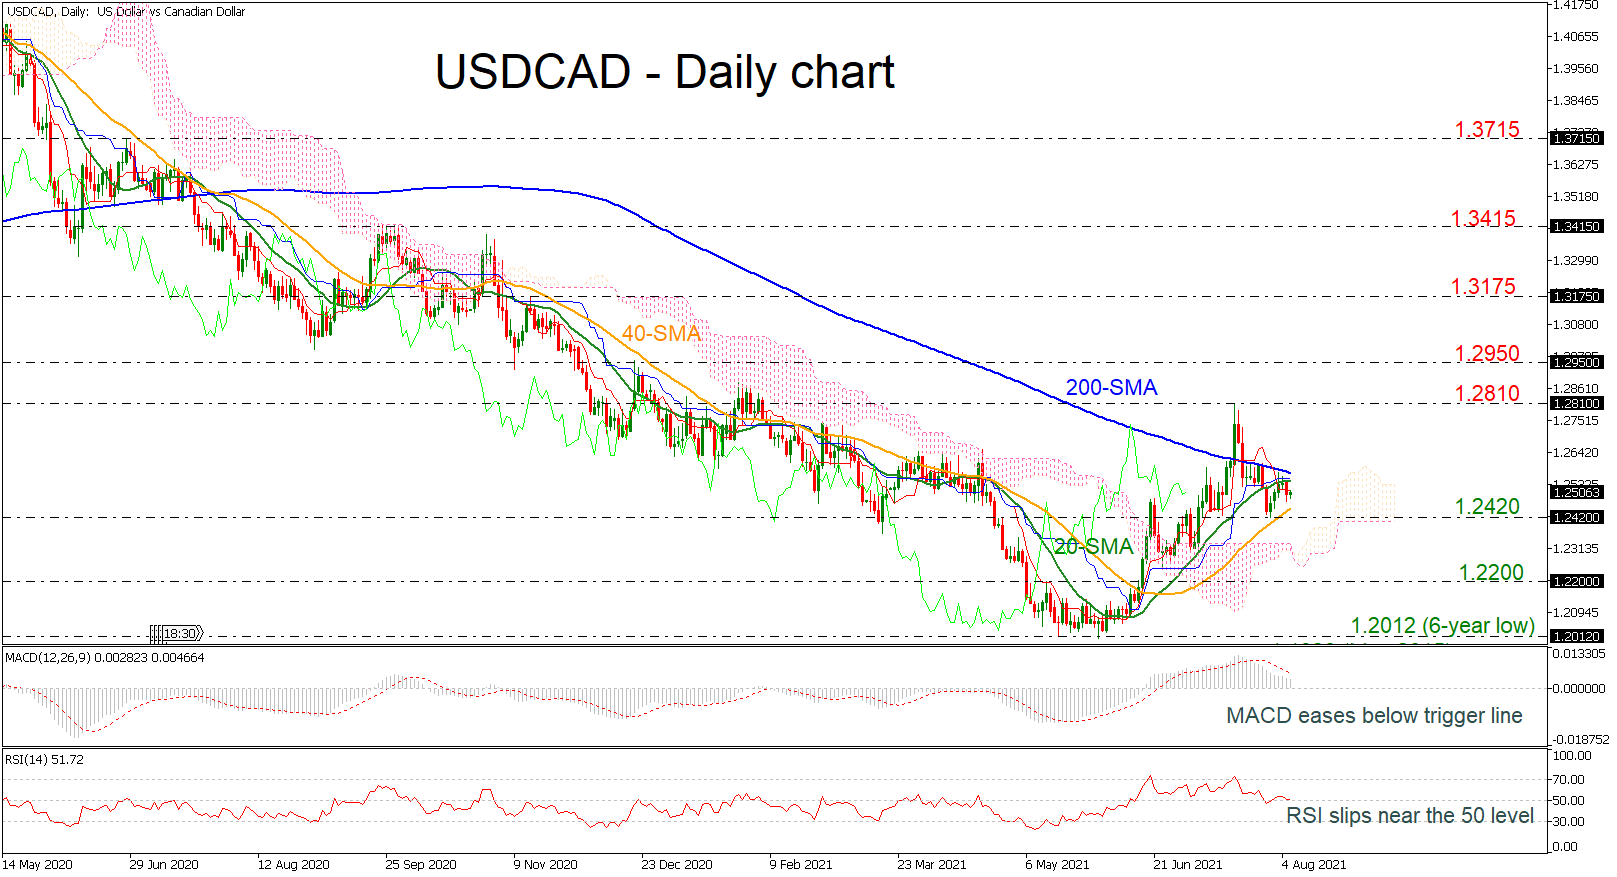
 USDCAD is retreating beneath the 20- and the 200-day simple moving averages (SMAs), slipping below the 1.2500 round number.
In trend indicators, the red Tenkan-sen line declined below the blue Kijun-sen line, while the short-term SMAs are turning lower. The MACD oscillator is travelling beneath its trigger line but is still developing above the zero level. Furthermore, the RSI is sloping down, touching the neutral threshold of 50.
More decreases could open the way for the 40-day SMA, which is currently standing near the 1.2420 support level. Overcoming this line, the 1.2200 psychological level could be in the spotlight ahead of the six-year low of 1.2012, achieved on June 1.
On the other side, a rally beyond the 200-day SMA could take the market towards the latest high of 1.2810. A jump above this critical resistance could open the way for more buying interest in the near-term, meeting 1.2950 and 1.3175.
Summarizing, in the short term, USDCAD has been in a bullish bias after the bounce off 1.2012. However, in the bigger picture, the outlook remains negative.
Origin: XM