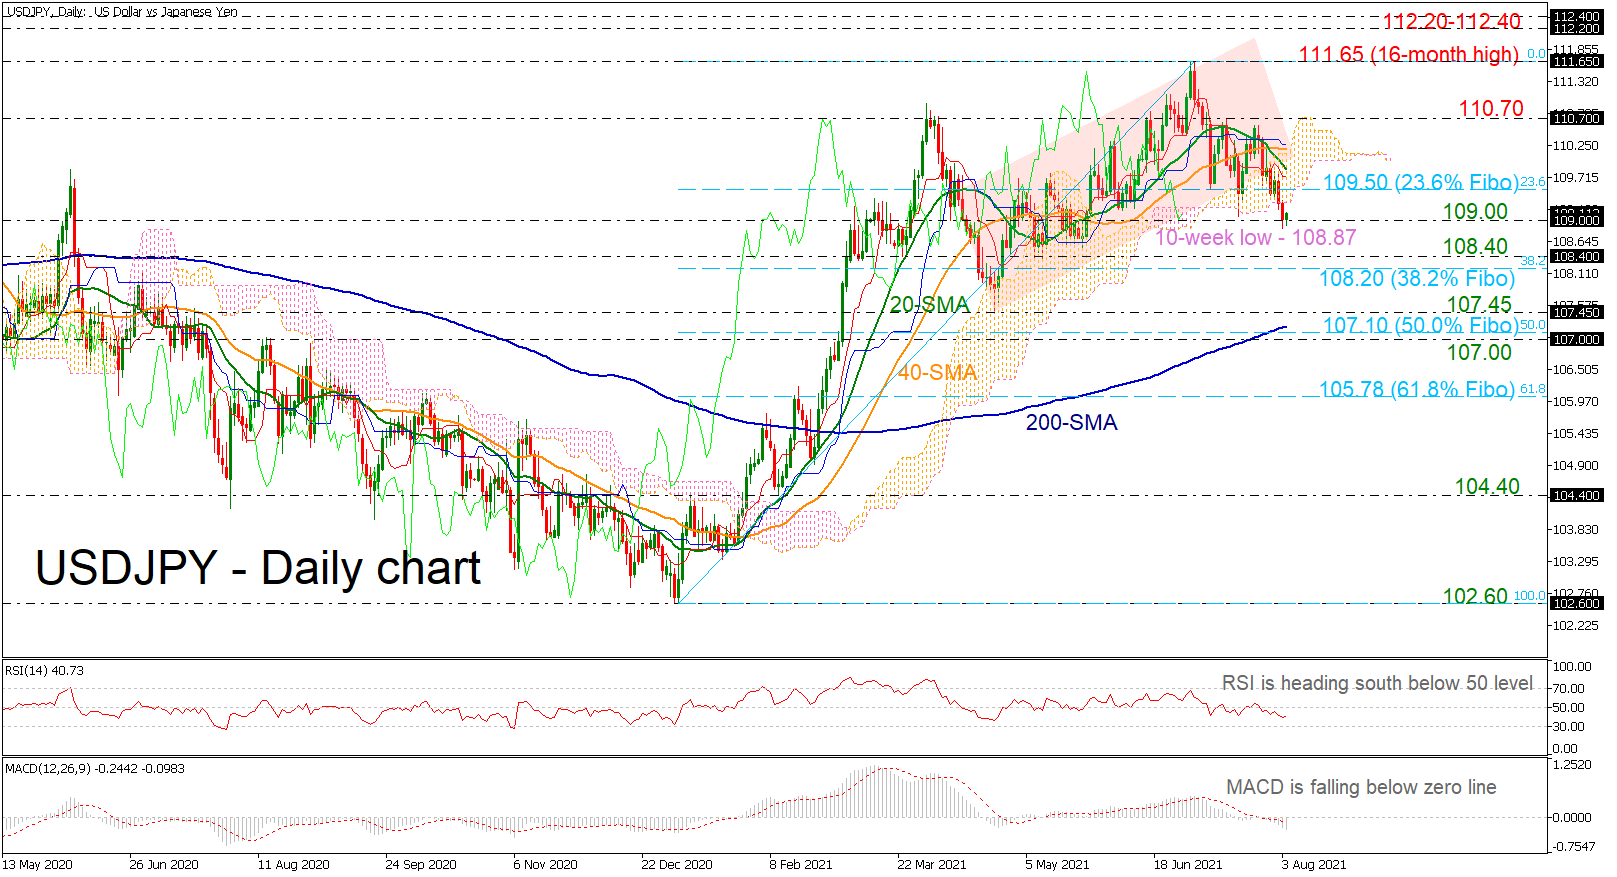
 USDJPY is holding beneath the ascending channel in the medium-term, sending the market below the 109.00 handle. The price posted a ten-week low at 108.87 and the technical indicators are confirming this view. The RSI is falling below the neutral threshold of 50, while the MACD is extending its bearish move below its trigger line.
More selling interest could meet the 108.40 support level and the 38.2% Fibonacci retracement level of the up leg from 102.60 to 111.65 at 108.20. Even lower, the focus could turn to 107.45 and the 200-day simple moving average (SMA) around the 50.0% Fibonacci of 107.10.
On the flip side, an increase above the 23.6% Fibonacci of 109.50 could take the bulls towards the 20- and 40-day SMAs at 109.90 and 110.20 respectively. A rally beyond these levels could open the way for 110.70 and the 16-month peak of 111.65.
In conclusion, in the case of further declines below the 200-day SMA, the broader outlook would shift to bearish. However, any successful attempts above the 16-month high of 111.65 could add optimism for bullish actions.
Origin: XM